

What will the Fed’s updated dot plots signal to the market?
- 05.26.23
- Markets & Investing
- Commentary
Review the latest Weekly Headings by CIO Larry Adam.
Key Takeaways
- Headline risks on the debt ceiling will drive markets
- Focus will soon shift to The Fed’s updated dot plots
- Inflation trajectory still on a solid downward path
As we head into Memorial Day weekend, the unofficial kick off to the summer, the Investment Strategy Group would like to honor and remember all the fallen men and women in our armed forces who sacrificed their lives for our country. Whether you visit a cemetery, hold a family gathering, attend a parade, head to the beach or a barbeque with friends, enjoy spending time with your loved ones. And this year is shaping up to be a busy one! AAA is forecasting 42 million will travel by road, air or other modes of transportation this Memorial Day weekend – a 7% increase over last year’s levels. In fact, summer travel is closing in on pre-pandemic levels, with this year’s volume expected to be the third highest in the last twenty years – largely led by air travel. While summer vacation or staycation plans are on everyone’s minds, there are plenty of important market moving events to stay on top of this summer that have the potential to shape the directional outlook for the financial markets in the months ahead. Some of these include:
- The dog days of the debt deal | Despite positive momentum at times, a debt ceiling deal remains elusive as the two sides have yet to reach a compromise on lifting or suspending the $31 trillion debt limit. Once again, the negotiations are likely to extend into the eleventh hour before an agreement is reached. While the issues are getting worked out, the main sticking point is centered on future discretionary spending – more specifically, what baseline to start from (i.e., FY22 or FY23) and the duration the spending caps will remain in place. With only a week to go before we cross Treasury Secretary Yellen’s early June x-date deadline, concerns about the debt ceiling and the potential of a U.S. default are rising. Fitch just placed the U.S. on watch for a downgrade from its AAA status given the ongoing brinkmanship and there have been further dislocations in the Treasury bill market. In fact, the Treasury’s new 21-day cash management bill maturing on June 15 sold with a yield of 6.20% at auction – significantly higher than other nearby maturities. Expect headline risks to persist until a final agreement is in place, with a deal likely to come in the final hours (we hope!).
- Will the Fed dot plots signal stormy clouds or blue skies ahead? | Market expectations for the implied December fed funds rate have gyrated all year long – rising to a high of ~5.6% after a hot jobs report to a low of ~3.9% amid heightened banking sector stress and now reversing again as policymakers push back against the notion of a Fed pivot this year. To be fair, the data has been conflicting. On one hand, core services inflation ex-housing remains elevated, the labor market remains strong, and recent housing data is showing early signs of a revival. On the other, anecdotal signs (i.e., claims, quits rates, job openings) point to slowing labor conditions, inflation is moving on a steady downward path, and tighter credit conditions pose downside risks to the growth outlook. With the glide path of the economy remaining uncertain, it begs the question: are policymakers still comfortable with a 5.1% (the mid-point between the 5.0% – 5.25% target range) terminal rate? As a reminder, seven (out of 19) committee members expected fed funds to peak above 5.25% in the March dot plots, with a median forecast of 4.1% in 2024. Our economist believes the Fed is done, or should be done, raising rates this year, although no cuts are on the immediate horizon. Two important data points leading into the June 13-14 Fed meeting (which includes the new dot plot) are the upcoming employment report (June 2) and CPI report (June 13).
- Inflation’s sizzle will soon start to fizzle | The news on the inflation front is trending in the right direction, with headline inflation falling from a peak of 9.1% in June 2022 to just under 5.0% and the core measure falling from its peak of 6.6% in September 2022 to 5.5%. While numerous Fed officials have stated inflation has not fallen fast enough, we suspect the next few months will show a sharp decline at just the right time. Why? First, when you look over the last 12 months, two of the hottest monthly gains are set to roll out of the 12-month rolling year-over-year calculation in the coming months, which will drive the annual pace of inflation lower. Second, one of the biggest components of inflation – shelter – is starting to rollover. And with the annual growth in rental prices normalizing from last year’s dramatic spike, the pace of shelter costs should steadily retreat. More important, with shelter costs the largest contributor to overall inflation in recent months, a deceleration will be welcome news for the Fed and the markets.
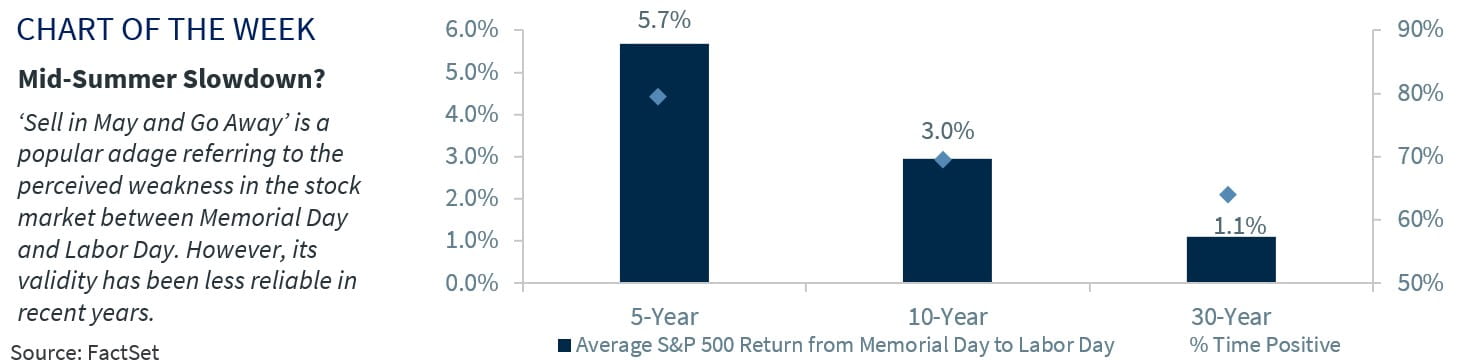
- Summertime seasonal blues | 'Sell in May and Go Away' is a popular adage referring to the perceived seasonal weakness in the stock market between Memorial Day and Labor Day. Our analysis of the last thirty years of the S&P 500 reveals that this period has produced a 1.1% average return – a mediocre return profile that supports the notion that the summer exhibits the weakest period of the calendar year. But we discourage investment decisions made solely on seasonal factors. Case in point: this seasonal pattern has not worked well over the last ten years, with the S&P 500 up ~3.0% during this period and positive 70% of the time. It has been even less effective over the last five years! While there are plenty of risks on the horizon, we advocate focusing on macro and corporate fundamentals; relying on simplistic seasonal factors to time the market could ultimately scorch your long-term performance.
All expressions of opinion reflect the judgment of the author(s) and the Investment Strategy Committee, and are subject to change. This information should not be construed as a recommendation. The foregoing content is subject to change at any time without notice. Content provided herein is for informational purposes only. There is no guarantee that these statements, opinions or forecasts provided herein will prove to be correct. Past performance is not a guarantee of future results. Indices and peer groups are not available for direct investment. Any investor who attempts to mimic the performance of an index or peer group would incur fees and expenses that would reduce returns. No investment strategy can guarantee success. Economic and market conditions are subject to change. Investing involves risks including the possible loss of capital.
The information has been obtained from sources considered to be reliable, but we do not guarantee that the foregoing material is accurate or complete. Diversification and asset allocation do not ensure a profit or protect against a loss.
