Chief Economist Eugenio J. Alemán discusses current economic conditions.
It is clear that economic indicators have been all over the place since the end of the pandemic recession in 2020 and that there is a lot of noise in these indices. Last Friday’s nonfarm payrolls survey versus the household survey was one of these contradictory indicators with nonfarm payrolls showing 339,000 new jobs added while the household survey showed a decline of 310,000 jobs during the month of May. Economists trust the nonfarm payroll number more than the household number in general because it is the one that follows recession more closely. Furthermore, the Bureau of Labor Statistics has an adjusted household survey series that more closely matches the payroll number over time. Thus, we also tend to trust the nonfarm payroll number more than the household survey even though alarm bells start to sound loudly when we see such large mismatches between the surveys.
Having said this, the payroll number gets revised over time so in some instances, the household survey may be a better indicator of the state of the U.S. labor market. The problem is that we don’t know, ex-ante, whether the payroll survey is in line for a large revision, which means that the household survey may be the better measure. Furthermore, last week’s increase in the jobs opening number seems to back up the nonfarm payroll number while this week’s sharp increase in the initial jobless claims seem to give more credence to the household survey. If you are confused at this point, you should be, because all the numbers point in different directions and economists at the Federal Reserve (Fed) have the same issues interpreting these different signals as economists outside the Fed.
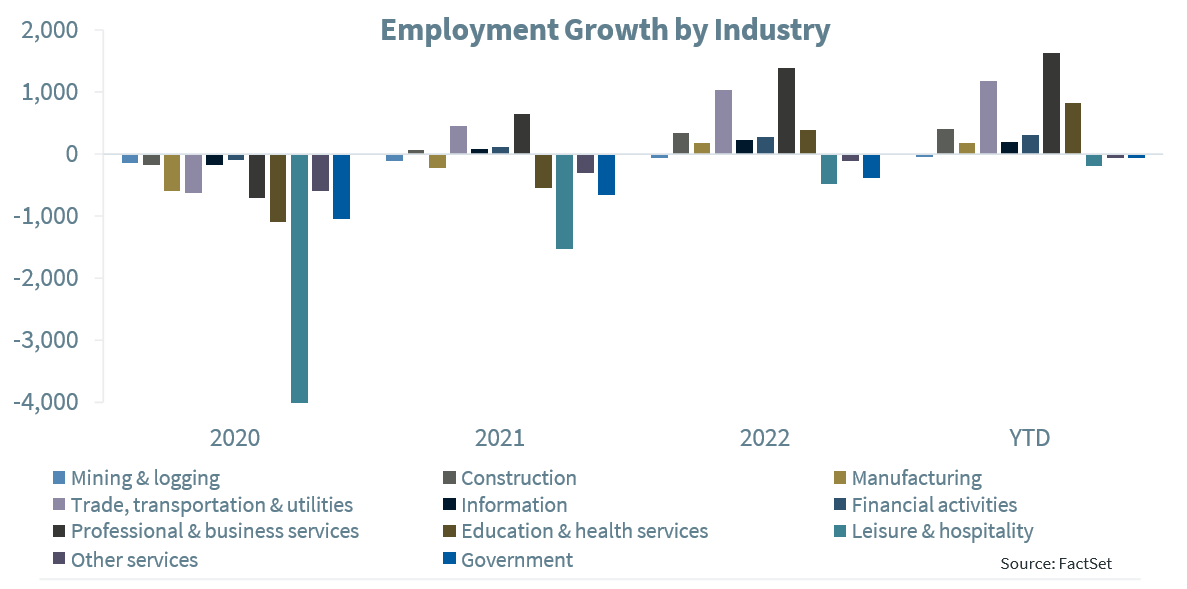
If we take a look at what has happened to employment since before the COVID-19 pandemic recession (see graph below), there are, fundamentally, seven broad sectors of employment that have been leading the way in terms of employment growth, according to the nonfarm payroll employment survey. However, the strongest of these sectors have been trade, transportation & utilities, professional & business services, and education & health services, with the other four growing but not as strongly as these three.
On the other hand, the laggard sectors since the pre-pandemic recession have been the leisure & hospitality sector, which was the most affected sector during the pandemic recession, as shown in the graph above and, to a lesser extent, mining & logging, other services, and finally, the government sector. Thus, it is fair to say that, from this perspective, the leisure & hospitality sector may well remain front and center in job creation during the second half of the year. As of May of this year, that is, year-to-date, this sector is still below its pre-COVID-19 recession level by about 200,000 jobs. Other employment sectors that are still below the levels of employment that existed pre-COVID pandemic recession are the mining & logging, other services, and the government sector.
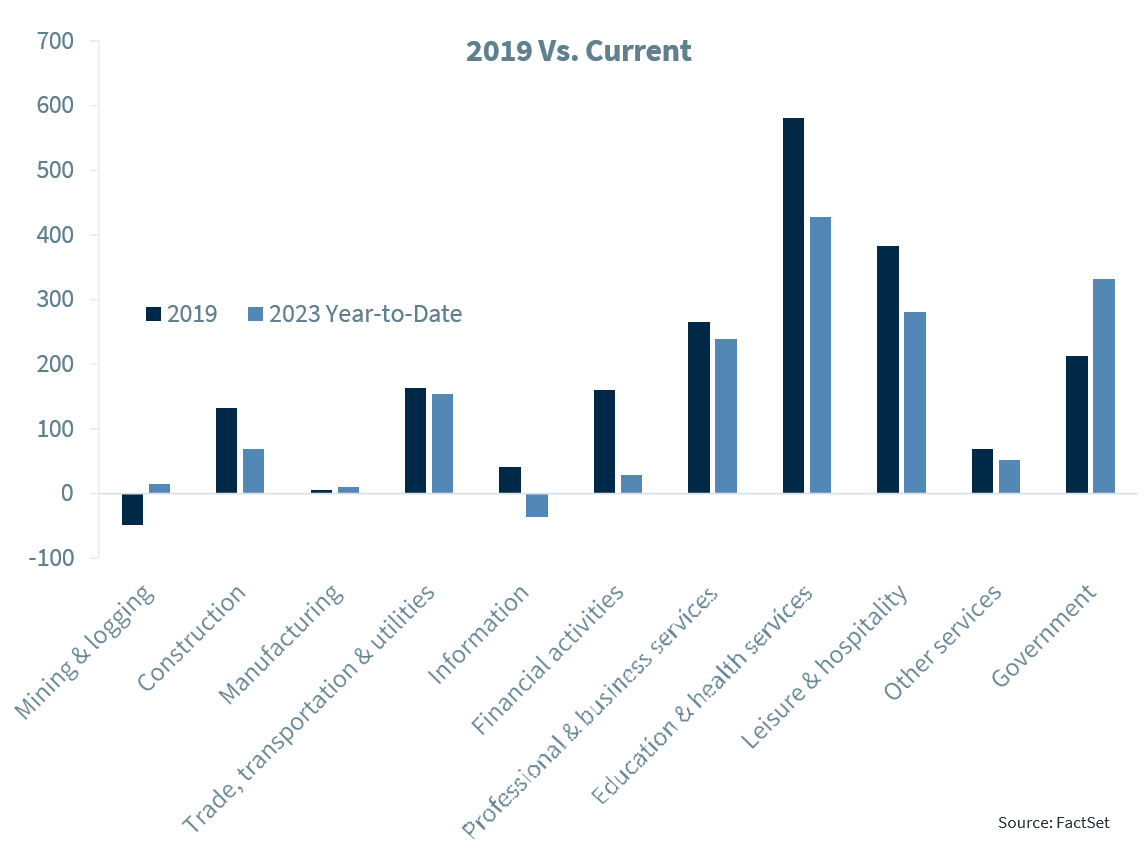
If we take a look at what has happened so far this year to the employment sectors it is clear that we have to expect a weakening trend in employment growth during the second half of this year. As we can see in the graph below, if we compare this year’s year-to-date employment growth with full year employment growth in 2019, which was a more ‘normal’ year than the years between 2020 and 2022 and during which time real gross domestic product increased 2.2%, there are three sectors that have already created more jobs in 2023 than in all of 2019. These sectors are mining and logging, manufacturing, and the government sector. Thus, we should expect some of these sectors to shed some workers during the second half of the year.
But we should also see a relatively strong slowdown in job creation in the rest of the sectors because they have grown too much during the first five months of the year compared to the number of jobs created, on average, during 2019. Furthermore, we are expecting real GDP growth for the whole of this year to be close to 1.3% compared to a growth rate of 2.2% during the whole of 2019.
Changes to our economic forecast
Continued strength in the U.S. labor market has made us change our forecast for the start of the recession once again, this time from a Q3 2023 start to a Q4 2023 start. This means that we have slightly stronger growth in 2023, up 1.3% for the whole year compared to 1.2% in our previous forecast, but a lower growth rate for the whole of 2024, up only 0.6%, compared to a growth rate of 1.2% in our previous forecast. We remain in the camp of a relatively mild recession that will span two quarters, Q4 2023 and Q1 2024, followed by a recovery during the rest of 2024.
We are also expecting the Fed to stay put regarding the federal funds rate decision in June, but recognize that it will remain hawkish and that, if inflation does not behave according to its expectations, there will still be a possibility for the Fed to increase interest rates further during this tightening cycle. If that is the case, we will have to revise our economic forecast at that time and take into consideration the potential effects of higher interest rates in the economy.
Furthermore, we have also accelerated the decline in the federal funds rate after the Fed starts its campaign to decrease interest rates, which we expect to happen during the second quarter of 2024 and now have an end-of-2024 federal funds rate of 3.50% rather than 4.25% in our previous forecast.
Economic and market conditions are subject to change.
Opinions are those of Investment Strategy and not necessarily those of Raymond James and are subject to change without notice. The information has been obtained from sources considered to be reliable, but we do not guarantee that the foregoing material is accurate or complete. There is no assurance any of the trends mentioned will continue or forecasts will occur. Last performance may not be indicative of future results.
Consumer Price Index is a measure of inflation compiled by the US Bureau of Labor Statistics. Currencies investing is generally considered speculative because of the significant potential for investment loss. Their markets are likely to be volatile and there may be sharp price fluctuations even during periods when prices overall are rising.
Consumer Sentiment is a consumer confidence index published monthly by the University of Michigan. The index is normalized to have a value of 100 in the first quarter of 1966. Each month at least 500 telephone interviews are conducted of a contiguous United States sample.
Personal Consumption Expenditures Price Index (PCE): The PCE is a measure of the prices that people living in the United States, or those buying on their behalf, pay for goods and services. The change in the PCE price index is known for capturing inflation (or deflation) across a wide range of consumer expenses and reflecting changes in consumer behavior.
The Consumer Confidence Index (CCI) is a survey, administered by The Conference Board, that measures how optimistic or pessimistic consumers are regarding their expected financial situation. A value above 100 signals a boost in the consumers’ confidence towards the future economic situation, as a consequence of which they are less prone to save, and more inclined to consume. The opposite applies to values under 100.
Certified Financial Planner Board of Standards Inc. owns the certification marks CFP®, CERTIFIED FINANCIAL PLANNER™, CFP® (with plaque design) and CFP® (with flame design) in the U.S., which it awards to individuals who successfully complete CFP Board's initial and ongoing certification requirements.
Links are being provided for information purposes only. Raymond James is not affiliated with and does not endorse, authorize or sponsor any of the listed websites or their respective sponsors. Raymond James is not responsible for the content of any website or the collection or use of information regarding any website's users and/or members.
GDP Price Index: A measure of inflation in the prices of goods and services produced in the United States. The gross domestic product price index includes the prices of U.S. goods and services exported to other countries. The prices that Americans pay for imports aren't part of this index.
The Conference Board Leading Economic Index: Intended to forecast future economic activity, it is calculated from the values of ten key variables.
The Conference Board Coincident Economic Index: An index published by the Conference Board that provides a broad-based measurement of current economic conditions.
The Conference Board lagging Economic Index: an index published monthly by the Conference Board, used to confirm and assess the direction of the economy's movements over recent months.
The U.S. Dollar Index is an index of the value of the United States dollar relative to a basket of foreign currencies, often referred to as a basket of U.S. trade partners' currencies. The Index goes up when the U.S. dollar gains "strength" when compared to other currencies.
The FHFA House Price Index (FHFA HPI®) is a comprehensive collection of public, freely available house price indexes that measure changes in single-family home values based on data from all 50 states and over 400 American cities that extend back to the mid-1970s.
Import Price Index: The import price index measure price changes in goods or services purchased from abroad by U.S. residents (imports) and sold to foreign buyers (exports). The indexes are updated once a month by the Bureau of Labor Statistics (BLS) International Price Program (IPP).
ISM New Orders Index: ISM New Order Index shows the number of new orders from customers of manufacturing firms reported by survey respondents compared to the previous month. ISM Employment Index: The ISM Manufacturing Employment Index is a component of the Manufacturing Purchasing Managers Index and reflects employment changes from industrial companies.
ISM Inventories Index: The ISM manufacturing index is a composite index that gives equal weighting to new orders, production, employment, supplier deliveries, and inventories.
ISM Production Index: The ISM manufacturing index or PMI measures the change in production levels across the U.S. economy from month to month.
ISM Services PMI Index: The Institute of Supply Management (ISM) Non-Manufacturing Purchasing Managers' Index (PMI) (also known as the ISM Services PMI) report on Business, a composite index is calculated as an indicator of the overall economic condition for the non-manufacturing sector.
Consumer Price Index (CPI) A consumer price index is a price index, the price of a weighted average market basket of consumer goods and services purchased by households. Changes in measured CPI track changes in prices over time.
Producer Price Index: A producer price index (PPI) is a price index that measures the average changes in prices received by domestic producers for their output.
Industrial production: Industrial production is a measure of output of the industrial sector of the economy. The industrial sector includes manufacturing, mining, and utilities. Although these sectors contribute only a small portion of gross domestic product, they are highly sensitive to interest rates and consumer demand.
The NAHB/Wells Fargo Housing Opportunity Index (HOI) for a given area is defined as the share of homes sold in that area that would have been affordable to a family earning the local median income, based on standard mortgage underwriting criteria.
The S&P CoreLogic Case-Shiller U.S. National Home Price NSA Index measures the change in the value of the U.S. residential housing market by tracking the purchase prices of single-family homes.
The S&P CoreLogic Case-Shiller 20-City Composite Home Price NSA Index seeks to measures the value of residential real estate in 20 major U.S. metropolitan.
Source: FactSet, data as of 5/26/2023