Average Returns vs Actual Returns
What are the major benefits to a broadly diversified portfolio?
Diversification serves several purposes. One of the overlooked benefits is how the reduction of volatility can improve the performance of your portfolio.
That is the reason we have some portion of portfolios invested in lower risk assets, like high quality bonds.
This type of diversification reduces the volatility that would occur in a 100% stock portfolio. This also makes it easier for investors to hang in there for the inevitable ups and downs of the market, which is when emotions can lead investors to make some big mistakes.
But there are real financial benefits to smoothing your return also.
Below is simple example of how an investment strategy that reduces volatility helps you financially, not just psychologically.
Would you rather earn a simple average 8% or 7% in your portfolio?
It seems like a simple question, and most of us would certainly pick 8%. But let’s look at the 8% average annual return with significant volatility first.
A $100,000 portfolio that is up 35% in year 1, down 16% in year 2, and up 5% in year 3 has a simple average annual return of 8%. Let’s see how this works in real life.

Now, let’s take a look at a 7% average annual return with moderate volatility. A portfolio that is up 22% in year 1, down 6% in year 2, and up 5% in year 3 has an average annual return of 7%.
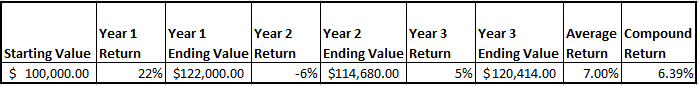
In just 3 years, the lower average annual return of 7% with less volatility created more wealth.
The degree of volatility a portfolios incurs affects the compound return. And it is the compound return that drives wealth. In just 3 years, you can see the benefit to your portfolio value of having steadier returns. Obviously over many years, the difference can be really significant.
Also, diversification within the stock market has also proven to be paramount to increasing an investor’s probability of success. Studies have shown, over a variety of time frames, that the entire market does much better than the average stock. It seems counterintuitive, but the facts are very clear.
A study done recently looked at a 31 year period, from 1987-2017 of the Russell 3,000 index – which comprises most of the U.S. stock market. The chart below illustrates the reality of investing in the stock market.
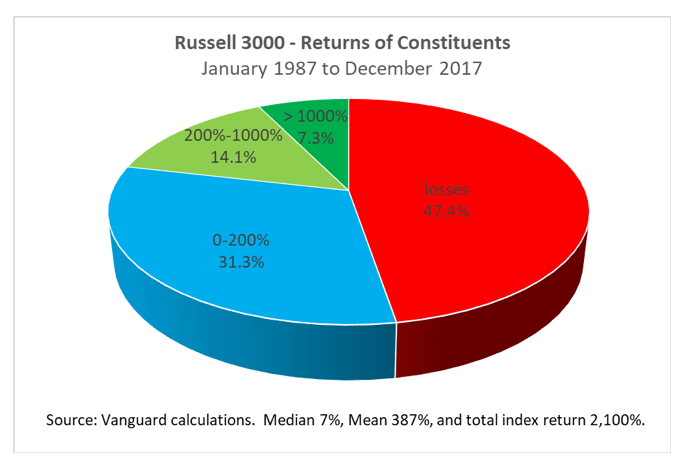
The entire index had a cumulative return of 2,100% over the 31 year period… but almost half the stocks lost money.
What gives?
The key was approximately 7% of those 3,000 were up over 1,000%. And if you didn’t own those 7% of all the 3,000 stocks, you earned much less than the entire index.
For reference, here are the top 30 stocks over the past 30 years:
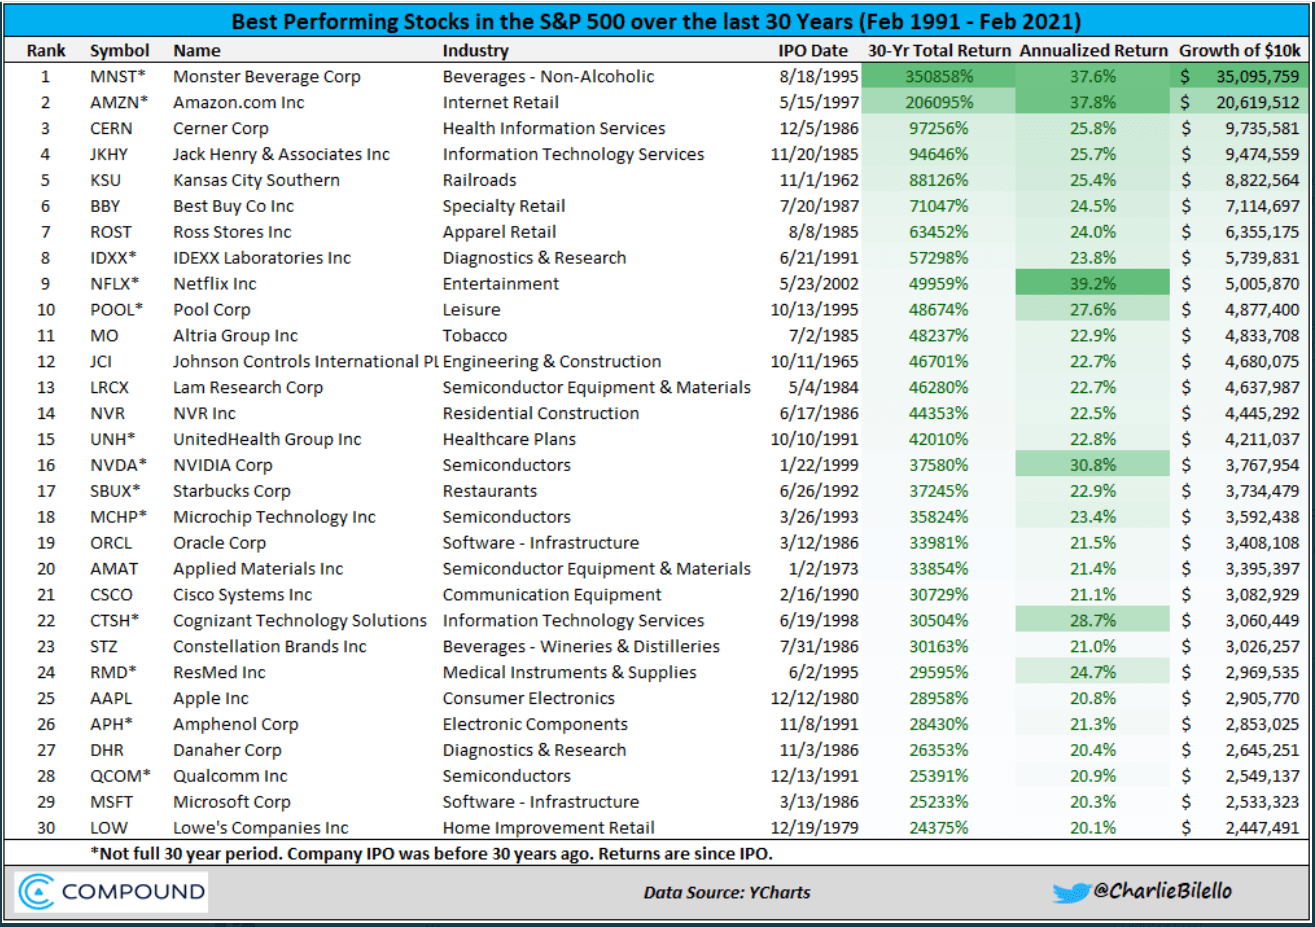
To the best of my memory, no client has asked me about Monster Beverage, Cerner Corp, Jack Henry & Associates, and Kansas City Southern … 4 of the 5 top names.
And that is why we implement broad diversification in your assets to provide you with the highest probability of reaching your goals.
Please let us know if you have any thoughts or questions. As always, thank you for your trust and confidence in us.
Beach
Diversification does not ensure a profit or guarantee against a loss. Keep in mind that individuals cannot invest directly in any index, and index performance does not include transaction costs or other fees, which will affect actual investment performance. Individual investor's results will vary. Past performance does not guarantee future results.
