Too Much Money in the System?
We now have a record 8.1 million job openings (see chart below), and signs everywhere saying “Help Wanted”. So why is the U.S. Government continuing to send an extra $300 a week to individuals, on top of state unemployment checks?
JOB OPENINGS
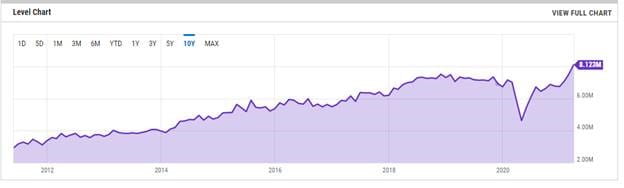 Source: Ycharts.com
That is a good question, and there are several other questions that we are asking as we continually try to assess risk and reward scenarios for our clients. While we don’t have answers to all the questions, we want you to know that we are always looking at “what ifs” to determine how to minimize the possibility of bad outcomes for our clients. We thought some questions and charts can help demonstrate what an unusual environment we find ourselves in today. These questions and charts reflect the reality (and dilemma) in which we are investing our clients’ assets.
Milton Friedman, one of the most prominent economists in our country’s history, has several famous quotes that seem timely in today’s economy. One is “Inflation is caused by too much money chasing too few goods.” During the last 12 months the amount of money in our financial system has grown at a rate which we have never seen before. If too much money can cause inflation, the chart below certainly seems to raise concern.
RATE OF CHANGE IN MONEY SUPPLY
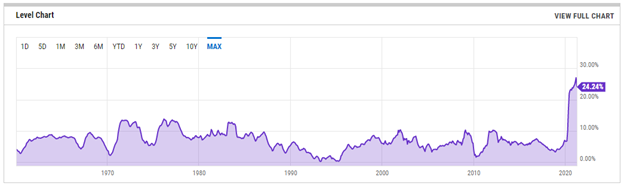 Source: Ycharts.com
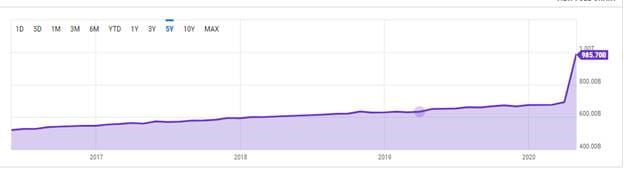
Why are banks paying such low rates to depositors? A quick look at the chart below may help explain that. The chart below shows the annual rate of growth of checkable deposits in U.S. banks. Simply put, the banks don’t want any more money- they have more than they can profitably lend right now. The last year has seen bank deposits increase dramatically as stimulus checks have been deposited instead of spent.
CHECKABLE BANK DEPOSITS
 Source: Ycharts.com
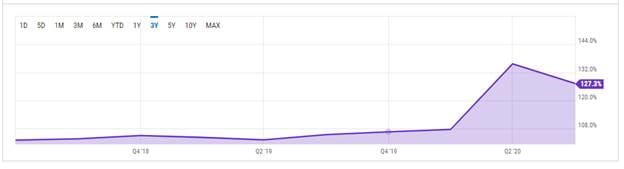
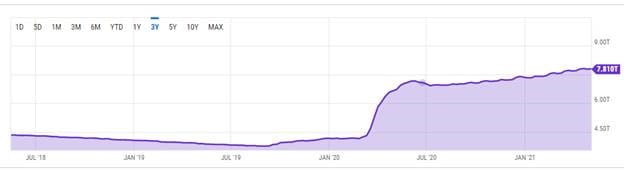
So where is all this money coming from? The Federal Government has borrowed an incredible amount of money to finance the stimulus and unemployment expenditures. Much of this borrowing has been financed by the Federal Reserve Bank (the Fed), which buys Treasury bonds from banks, keeping the interest rate down on the debt our government issues. Below is a chart showing the rate of growth of U.S. government debt over the last 3 years.
DEBT OF U.S. GOVERNMENT
 Source: Ycharts.com
As we mentioned, the Federal Reserve has been buying many of these newly issued bonds and is illustrated by a big jump in the Federal Reserve’s balance sheet.
FEDERAL RESERVE BALANCE SHEET
 Source: Ycharts.com
What would the interest rate be for bonds if the Fed was not buying $80 billion of U.S. Treasuries and $40 billion of mortgages every month? We don’t know exactly, but a good guess would be higher than they currently are.
What are some of the consequences of all these dramatic steps being implemented by the government? Below is a chart showing the most recent change of inflation as measured by the Consumer Price Index. Admittedly, it is comparing to prices in April 2020 when many prices were dropping precipitously. But we can’t rule out that this considerable jump in the rate of inflation could last longer.
CONSUMER PRICE INDEX
 Source: Ycharts.com
That is enough charts for one newsletter, but it demonstrates how dramatic some of the changes in monetary policy (controlled by the Fed) and the fiscal policy (controlled by Congress) have been.
Just as the pandemic was unprecedented, so are the policy responses to the pandemic. Now with the economy growing back very rapidly, but with monetary and fiscal policies designed for emergencies still in place, trying to understand the potential ramifications for you is our task.
One potential ramification is an increase in the long term rate of inflation. If markets perceive a threat of higher inflation, they can demand higher interest rates to compensate them for that risk. This can hurt long term bond prices, so we are in the process of modifying the bond portion of your portfolio to reduce that risk.
The stock market has been a good long-term hedge against inflation, but if there is a sudden increase in interest rates and inflation, we should expect the stock market to reflect that with an increase in volatility. But we are not looking at making any changes in the structure of the stock exposure in your portfolios.
I hope we didn’t over-chart you, but given the significant changes in various policies, we thought this would provide a better overview of current factors in today’s economy and markets.
As always, we will be in touch but in the interim don’t hesitate to call us.
Beach
Disclosure: The foregoing information has been obtained from sources considered to be reliable, but we do not guarantee that it is accurate or complete, it is not a statement of all available data necessary for making an investment decision, and it does not constitute a recommendation. Any opinions are those of Beach Foster and not necessarily those of Raymond James. Past performance may not be indicative of future results. Investing involves risk and you may incur a profit or loss regardless of strategy selected, including diversification and asset allocation. Rebalancing a non-retirement account could be a taxable event that may increase your tax liability. Investment strategies mentioned may not be suitable for all investors.
