Talking Head "Gurus"

To watch/listen to this week’s article click here.
“Don’t believe anything you hear and only half of what you see,” is an oldie but a goodie. There are always three sides to a story yours, theirs, and the truth. When the gurus come on TV in volatile markets, most people (including yours truly) sit up and listen. I’m not looking for a stock tip, but maybe some insight to the current situation that I have not given much thought to, and their take on what to expect over the short to medium term.

This bear market has been a heyday for the networks to roll out the “gurus” to help investors manage the storm, or so they put it. Instead, what I find is total baloney, with a number that I watched prove to contradict everything they tell you with their actions. Bill Ackman who is no stranger to the business channels is a noted Hedge Fund Manager, who came on to CNBC in late March and gave an emotional plea to shut down the economy. Ackman said that he believed 50% of the world’s population would be infected, and millions would die. In a tweet to President Trump, Ackman said, “send everyone home”. He went on to say that, “Hilton stock (which he owns) would go to zero, and the tsunami is coming!”. He also said he went to the bank and pulled out a lot of cash to have it on hand.
Last week I decided to look at what some of the gurus did during the time they came on TV and stated their bearish thoughts. There is a website www.gurufocus.com that tracks the 13F filings of the big name investment managers. A 13F is a quarterly report filed with the Securities and Exchange Commission by Institutional Investment Managers, with over $100 Million of assets. It requires them to list all the equities under management.
A look at Ackman’s holdings and trades through the first quarter of the year, shows that his fund owns 10 positions. During the quarter, the filing shows the fund made 2 new purchases, and added to 6 other positions, while reducing just one. The turnover of the fund was 35% for the quarter. This shows HUGE purchases, given that his fund is around $6.5 Billion.
Ackman was not alone in his contradictions. David Tepper who is loved by Wall Street, has been on multiple business shows spouting, “This is the second most overvalued market, only behind 1999, that I’ve ever seen,”. Tepper’s fund, Appaloosa Management, is a 3.2 Billion fund shows a 16% turnover, buying 13 new positions, and increasing stakes in a number of others.
There are many more than this, but I pick on these two as they were the most vocal about the state of affairs, and left investors believing the end is near. 13F filings are an intriguing read, that is if you’re into that sort of thing.
This is just another example of why making investment decisions based on what anyone who comes on TV tells you, is a sure way to have your lunch handed to you. The only way to invest in my view is to know the reason why you’re invested, select the appropriate strategy, and look for opportunities. Sure, the road gets bumpy sometimes, however that tends to be the time that the opportunities show themselves. We can’t get caught up in the hype of the gurus, no matter how big of a portfolio they manage. That’s mainly because there is nothing stopping them from telling you one thing and then going and doing the other, as we’ve seen in the past few months.
Now let’s move on to some charts and see where we are at. My old firm Merrill Lynch released a great research piece last week highlighting secular bull markets. A Secular Bull Market is a market driven by forces that are in place for several years. Conditions such as earnings growth and low interest rates have the ability to push a market higher over a long period. I’ve spoken about it before as I’ve believed that we have been in a secular bull market since about 2013, and I still believe we are in one, even given the state of the markets now.
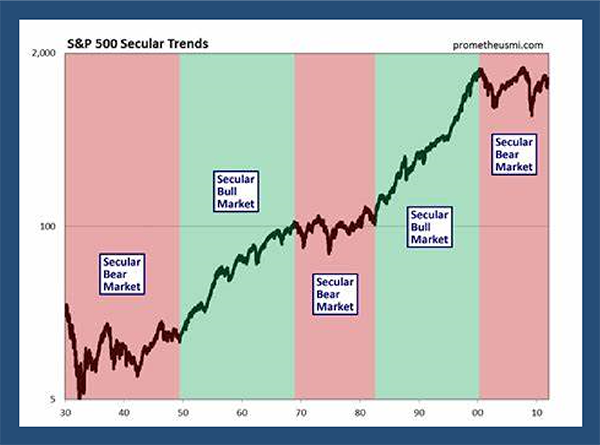
The Merrill research highlighted past secular bull markets and showed a common thread in the last three, (including this one). They all had “interruptions” in the seventh year of the cycle. Both 1957 and 1987 saw major pullbacks of similar magnitude to what we have just witnessed, but in both cases the bull market was only halfway done.

I usually show the JP Morgan chart below in presentations, which also shows the recessions associated. Note there were recessions in the secular bill markets between 1950-1966, as well as 1980 to 2000.

When we look at this bull market versus the past two, you can see this is lagging but has potential to make up ground given fiscal and monetary backing that the previous two did not have.
A couple of nice days last week, still have us butting up again the major resistance level of the S&P 500 at right around 3000. A breakthrough of this would be a very bullish sign for the short term. Some positive news from Moderna in the U.S. and Oxford in the UK on a vaccine sent the markets in a tear early in the week, and at the time of writing we have been able to hold most of those gains.
Too far, too fast, in both directions, has been the theme. Given that we are at 40 days from the recent lows and up about 30%, I took a look at previous big moves and what the next 40 days gave us. Overwhelmingly, the following 40 days although positive, have been choppy and stayed range bound. Now vaccine is a game changer, but other than that, I feel the market needs to digest where we are and begin to grasp the effects of what just happened to us.


A lot to digest this week, although nothing new… With all that here is the buy/sell.

Opinions expressed in the attached article are those of the author and are not necessarily those of Raymond James. All opinions are as of this date and are subject to change without notice. Diversification and asset allocation do not ensure a profit or protect against a loss. The S&P 500 is an unmanaged index of 500 widely held stocks that is generally considered representative of the U.S. stock market. Keep in mind that individuals cannot invest directly in any index, and index performance does not include transaction costs or other fees, which will affect actual investment performance. Individual investor's results will vary. Past performance does not guarantee future results. Investors should consult their investment professional prior to making an investment decision.
