This Is Why You Can't Time the Market

All smart money leading into the election was towards a blue sweep, which would be bad for the stock market. A hike in taxes, cumbersome regulation as well as a social agenda, left us all believing that the struggle would be real for the major stock market indexes.
I’ve spoken to many investors who went to cash prior to the election, as a prudent attempt to protect their gains since the March low. As the last few days have shown you, if you’ve read it or heard it, it’s already priced in.

The S&P 500 since election day has moved a staggering 7.48%, based on…well, who really knows? The talking heads on TV will tell you gridlock in Washington creates a goldilocks environment for stocks. While I hear others argue that the rally is fundamentally charged. Whatever you believe, the 3 days following the election is the best rally post an election in history.
I’ve shown you the chart below in a different format, however, I think it’s worth noting that missing the best days (not unlike we seen the day after the election), can cost you dearly.
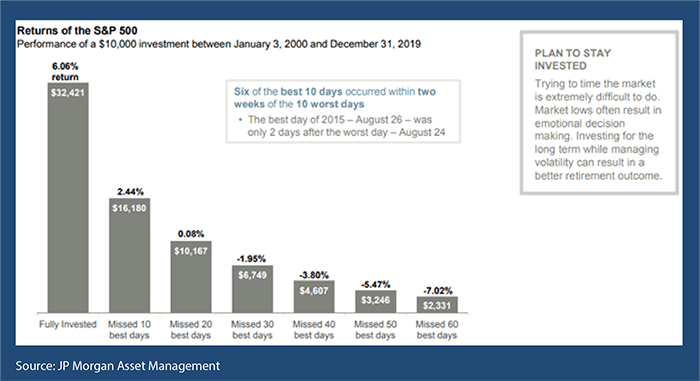
Source: J.P. Morgan Asset Management analysis using data from Bloomberg. Returns are based on the S&P 500 Total Return Index, an unmanaged, capitalization-weighted index that measures the performance of 500 large capitalization domestic stocks representing all major industries. Indices do not include fees or operating expenses and are not available for actual investment. The hypothetical performance calculations are shown for illustrative purposes only and are not meant to be representative of actual results while investing over the time periods shown. The hypothetical performance calculations for the respective strategies are shown gross of fees. If fees were included, returns would be lower. Hypothetical performance returns reflect the reinvestment of all dividends. The hypothetical performance results have certain inherent limitations. Unlike an actual performance record, they do not reflect actual trading, liquidity constraints, fees and other costs. Also, since the trades have not actually been executed, the results may have under- or overcompensated for the impact of certain market factors such as lack of liquidity. Simulated trading programs in general are also subject to the fact that they are designed with the benefit of hindsight. Returns will fluctuate and an investment upon redemption may be worth more or less than its original value. Past performance is not indicative of future returns. An individual cannot invest directly in an index. Data as of December 31, 2019.
I’ve spoken in the past week to a number of investors who moved to the sidelines while they “wait and see” what pans out. This logic creates probably the toughest question when investing which is, when do you get back in? Some of you asked me that question directly as well. The answer is not about whether you think the market will go up or down, the answer really is, has your timeline for investing changed? If it’s still that you want to invest for the remainder of your life, and perhaps a legacy for the next generation, then you can’t afford to be out of the market.
Now I hear some of you saying, “what if I was out during the worst days, how good would it look?” Undoubtedly it would improve your return, however as you see from the graph above, six of the best days in the past 20 years happened withing two weeks of the worst day. So, unless you had the discipline to buy on the days that are completely in the toilet, then you wouldn’t have benefited at all.
So, What from Here??
Well, I’m actually really excited. As a Certified Portfolio Manager, my objective is to have my portfolios beat their respective benchmarks. Usually that’s easier to do when markets are retreating as I don’t need to be 100% long, meaning if I have some cash in the accounts when the market is going down, the portfolio shouldn’t go down as much. However, where we are situated now, I believe that we are starting to see a rotation from what has worked over the past few years to things that have not worked so well.
The major indexes (S&P 500, Dow Jones Industrial Average and the Nasdaq) are all market cap weighted indexes. This means that the bigger companies have a bigger percentage of the overall index. Now given the biggest 5 stocks in the S&P 500 contributed around 80% of the return of the S&P 500 for the past 12 months. This in my opinion has caused a major problem that I’m not sure many people are seeing. As the big get bigger, they continue to take a bigger percentage of the indexes. The indexes keep climbing based on the biggest companies going up the most. This has the potential to create a void in the index if those major companies do not continue to grow the stock price.
I believe you could actually see a scenario where 80% of the components of the S&P 500 go up, but the major indexes actually go down. With algorithmic trading now that has the potential to cause some short term selling. Well you know what that would ultimately create???? Yep…opportunity. Opportunity that has been very rare for people managing portfolios.
The charts below are where I see the rotation starting. Now, in full disclosure we have seen a head fake several times over the past few months that this rotation was starting. In the investing world we call this “basing”. It’s quite possible that we could be seeing another head fake now, only time will tell. However, I do believe that starting to position yourself for this rotation is prudent.


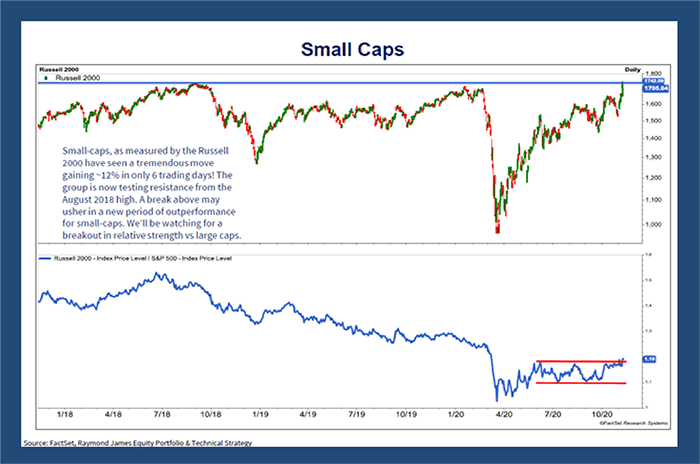
This again, is not an all or nothing scenario. Small steps away from the mega caps to the smaller caps over time is what’s called for. When these types of rotations happen, I argue that they happen over a market cycle. Although there is no specific time period defined for a market cycle, I always measure it over a 3-year period. My point, you don’t need to rush, just take the opportunities as they present themselves to you.
With that, here’s the Buy/Sell.

The information contained in this report does not purport to be a complete description of the securities, markets, or developments referred to in this material. The information has been obtained from sources considered to be reliable, but we do not guarantee that the foregoing material is accurate or complete.
Any opinions are those of Mick Graham, and not necessarily those of Raymond James. Expressions of opinion are as of this date and are subject to change without notice. There is no guarantee that these statements, opinions or forecasts provided herein will prove to be correct. Investing involves risk and you may incur a profit or loss regardless of strategy selected. Keep in mind that individuals cannot invest directly in any index, and index performance does not include transaction costs or other fees, which will affect actual investment performance. Individual investor's results will vary. Past performance does not guarantee future results. Future investment performance cannot be guaranteed, investment yields will fluctuate with market conditions.
Any information is not a complete summary or statement of all available data necessary for making an investment decision and does not constitute a recommendation. Forward looking data is subject to change at any time and there is no assurance that projections will be realized. There is no assurance that any investment strategy will be successful. Sector investments are companies engaged in business related to a specific sector. They are subject to fierce competition and their products and services may be subject to rapid obsolescence. There are additional risks associated with investing in an individual sector, including limited diversification. Investing in small cap stocks generally involves greater risks, and therefore, may not be appropriate for every investor. The prices of small company stocks may be subject to more volatility than those of large company stocks.
The S&P 500 is an unmanaged index of 500 widely held stocks that is generally considered representative of the U.S. stock market. The Dow Jones Composite Average is a stock index from Dow Jones Indexes that tracks 65 prominent companies. The average's components include every stock from the Dow Jones Industrial Average (30 components), the Dow Jones Transportation Average (20), and the Dow Jones Utility Average (15). The NASDAQ Composite is a stock market index that includes almost all stocks listed on the Nasdaq stock market. The S&P 500® Equal Weight Index (EWI) is the equal-weight version of the widely-used S&P 500. The index includes the same constituents as the capitalization weighted S&P 500, but each company in the S&P 500 EWI is allocated a fixed weight - or 0.2% of the index total at each quarterly rebalance. The S&P 500 Index or the Standard & Poor's 500 Index is a market-capitalization-weighted index of the 500 largest U.S. publicly traded companies. The MSCI Emerging Markets is designed to measure equity market performance in 25 emerging market indices. The index's three largest industries are materials, energy, and banks. The MSCI ACWI (All Country World Index) is a free float-adjusted market capitalization weighted index that is designed to measure the equity market performance of developed and emerging markets. As of June 2007 the MSCI ACWI consisted of 48 country indices comprising 23 developed and 25 emerging market country indices. The developed market country indices included are: Australia, Austria, Belgium, Canada, Denmark, Finland, France, Germany, Greece, Hong Kong, Ireland, Italy, Japan, Netherlands, New Zealand, Norway, Portugal, Singapore, Spain, Sweden, Switzerland, the United Kingdom and the United States. The emerging market country indices included are: Argentina, Brazil, Chile, China, Colombia, Czech Republic, Egypt, Hungary, India, Indonesia, Israel, Jordan, Korea, Malaysia, Mexico, Morocco, Pakistan, Peru, Philippines, Poland, Russia, South Africa, Taiwan, Thailand, and Turkey. The Russell 2000 Index measures the performance of the 2,000 smallest companies in the Russell 3000 Index, which represent approximately 8% of the total market capitalization of the Russell 3000 Index. Price to Earnings: the share price divided by the trailing / projected four quarter’s earnings per share results. Companies in the technology industry are subject to fierce competition, and their products and services may be subject to rapid obsolescence.
