

Real money supply and the real price of petroleum, examined
- 05.19.23
- Economy & Policy
- Commentary
Chief Economist Eugenio J. Alemán discusses current economic conditions.
The phrase “The dogs are barking Sancho, a sign that we are moving forward!” is used in Spanish to convey that if there is a lot of noise, it is because what we are doing is effective, and someone probably is not liking it.1 The phrase is well-known but is incorrectly attributed to the famous fictional character from the novel, Don Quixote de la Mancha, written by Miguel de Cervantes Saavedra.
At this point, you may ask, correctly, what does this have to do with economics or the economy? We ask that you continue to follow our argument as our line of thought is going to become clear in the next several paragraphs.
Over the last year or so, there has been a barrage of commentaries and stories going around the internet on economic topics like the U.S. dollar’s impending demise or issues on the U.S. creating a central bank digital currency, etc., that are clearly conveying that something is happening, that is: “The dogs are barking Sancho, a sign that we are moving forward!”
We have already written about what we think about the ‘impending’ demise of the U.S. dollar. However, today, we thought we should write about money supply and the price of petroleum, but more specifically, about real money supply and the real price of petroleum, that is, adjusted for inflation. We are not going to write about what we think the price of petroleum is going to be, we leave that to the experts on this topic. What we are going to write about is what happens to the price of petroleum, ‘normally,’ when monetary authorities decide it is time to shrink the money supply. 2
The reason for this is that we think that all of this noise is probably the consequence of current monetary policy in the U.S. as well as across the global economy. We think it is not a coincidence that the stories about the U.S. dollar’s demise involve some of the countries that have the most to lose if the price of petroleum declines – Saudi Arabia and Russia.
1 This is our translation of the original Spanish phrase “Ladran, Sancho, Señal que ”
2 We say ‘normally’ here because it is not always the case. One of us learnt early in our professional career as an economist that it is very difficult, if not impossible, to forecast oil prices because the price of oil is not only determined by market forces but also by the whims of the OPEC and OPEC+
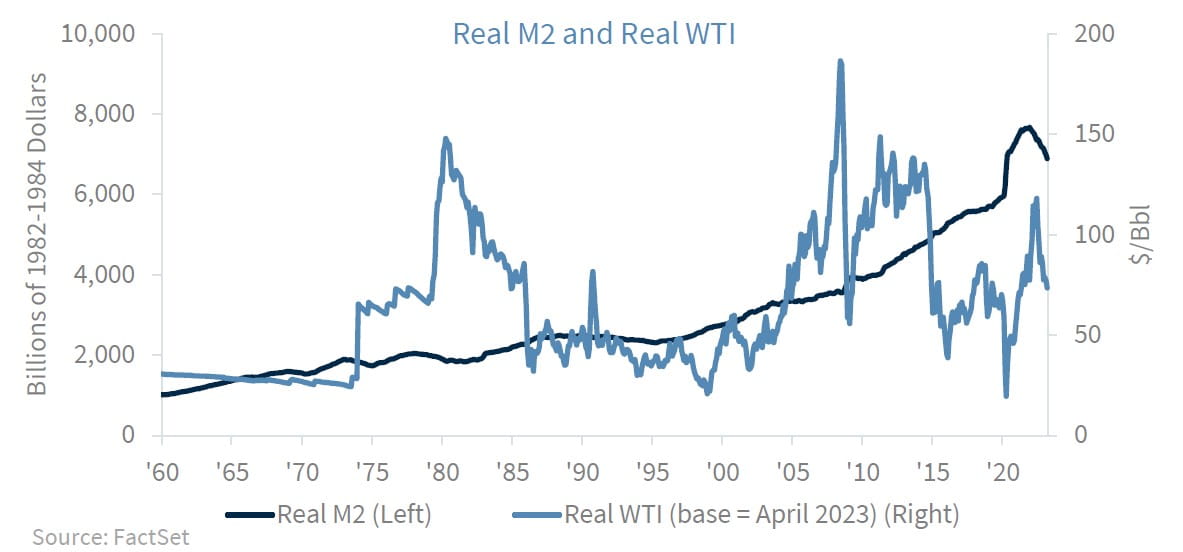
In the graph on the previous page, we have plotted the real price of West Texas Intermediate (WTI) petroleum as well as real M2, real money supply. Although it is fairly difficult to see the relationship between these two variables, it is somewhat clear that when real money supply is relatively constant or even declining, the price of petroleum remains low and/or comes down. The correlation between these two variables is 0.38 between December of 1960 and March of 2023. This is a very high correlation for levels of these variables. Furthermore, correlation does not mean causation, so more analysis needs to be conducted to gauge the true relationship between these two variables.
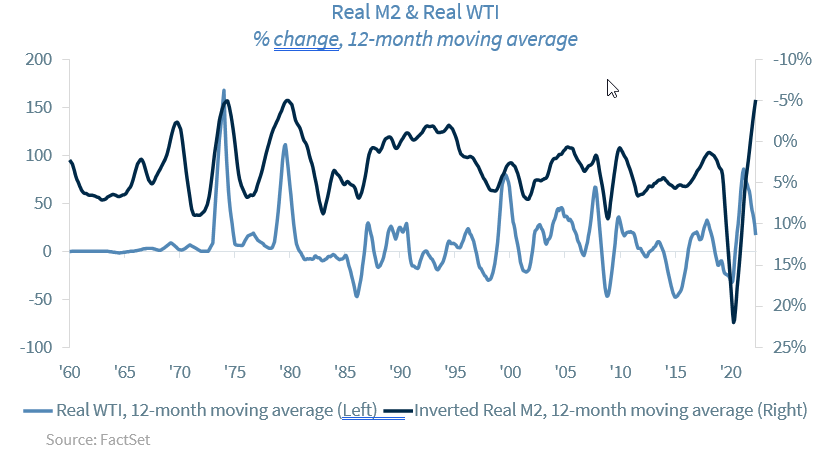
Furthermore, we also calculated the 12-month moving average rate of growth of real M2 and real WTI and we also plotted that relationship on the graph above. We also calculated the correlation of the rate of change between real M2 and real WTI and we get a negative correlation of 0.37. This is a relatively high correlation considering that this is a 12-month moving average rate between these variables. This means that, in general, a period of growth in the supply of real M2 is followed by a period of growth in the real price of petroleum, WTI. Conversely, a period of decline in the rate of growth of real M2 is followed by a period of decline in the real price of oil.
The trouble with cutting petroleum production today
The OPEC+ cartel has announced several petroleum production cuts over the last year or so. However, the price of petroleum, after a temporary upward spike following the announcement of such cuts in production, has tended to go down rather than up. So, the question is, why is it that with lower oil production, the OPEC+ cartel is having trouble increasing the price of petroleum. Once again, we are not experts on forecasting the price of petroleum, but we believe that there are, at least, two potential reasons for this.
First, there have been reports that the sanctions imposed on Russia after its invasion of Ukraine have made Russia sell its petroleum at a discount, and China and India are taking advantage of this situation and are buying directly from Russia at a lower price. This, of course, is putting downward pressure on the price of oil. Second, we believe that the slowdown in the growth rate of real money supply in the U.S. as well as in the rest of the world, is helping to put downward pressure on the real price of oil as well. This follows from the analysis we showed in the previous section.
Conclusion
Our conclusion is that the increased noise we have seen surrounding the U.S. dollar, the stories of the end of the petrodollar, the stories that Saudi Arabia, Brazil, Russia, and other countries are transacting in Russian rubles, or Chinese yuan (renminbi), etc., are probably just the consequence of increased noise due to the impending difficulty of keeping the price of petroleum high.
That is, as we argued in our dollar piece several months ago, that there is nothing there, there… today, we will say as Don Quixote would: “The dogs are barking Sancho, a Sign that we are moving forward!”
Economic and market conditions are subject to change.
Opinions are those of Investment Strategy and not necessarily those of Raymond James and are subject to change without notice. The information has been obtained from sources considered to be reliable, but we do not guarantee that the foregoing material is accurate or complete. There is no assurance any of the trends mentioned will continue or forecasts will occur. Last performance may not be indicative of future results.
Consumer Price Index is a measure of inflation compiled by the U.S. Bureau of Labor Statistics. Currencies investing is generally considered speculative because of the significant potential for investment loss. Their markets are likely to be volatile and there may be sharp price fluctuations even during periods when prices overall are rising.
Consumer Sentiment is a consumer confidence index published monthly by the University of Michigan. The index is normalized to have a value of 100 in the first quarter of 1966. Each month at least 500 telephone interviews are conducted of a contiguous United States sample.
Personal Consumption Expenditures Price Index (PCE): The PCE is a measure of the prices that people living in the United States, or those buying on their behalf, pay for goods and services. The change in the PCE price index is known for capturing inflation (or deflation) across a wide range of consumer expenses and reflecting changes in consumer behavior.
The Consumer Confidence Index (CCI) is a survey, administered by The Conference Board, that measures how optimistic or pessimistic consumers are regarding their expected financial situation. A value above 100 signals a boost in the consumers’ confidence towards the future economic situation, as a consequence of which they are less prone to save, and more inclined to consume. The opposite applies to values under 100.
Leading Economic Index: The Conference Board Leading Economic Index is an American economic leading indicator intended to forecast future economic activity. It is calculated by The Conference Board, a non- governmental organization, which determines the value of the index from the values of ten key variables
Certified Financial Planner Board of Standards Inc. owns the certification marks CFP®, Certified Financial Planner™, CFP® (with plaque design) and CFP® (with flame design) in the U.S., which it awards to individuals who successfully complete CFP Board's initial and ongoing certification requirements.
Links are being provided for information purposes only. Raymond James is not affiliated with and does not endorse, authorize or sponsor any of the listed websites or their respective sponsors. Raymond James is not responsible for the content of any website or the collection or use of information regarding any website's users and/or members.
GDP Price Index: A measure of inflation in the prices of goods and services produced in the United States. The gross domestic product price index includes the prices of U.S. goods and services exported to other countries. The prices that Americans pay for imports aren't part of this index.
FHFA House Price Index: The FHFA House Price Index is the nation’s only collection of public, freely available house price indexes that measure changes in single-family home values based on data from all 50 states and over 400 American cities that extend back to the mid-1970s.
Expectations Index: The Expectations Index is a component of the Consumer Confidence Index® (CCI), which is published each month by the Conference Board. The CCI reflects consumers' short-term—that is, six- month—outlook for, and sentiment about, the performance of the overall economy as it affects them.
Present Situation Index: The Present Situation Index is an indicator of consumer sentiment about current business and job market conditions. Combined with the Expectations Index, the Present Situation Index makes up the monthly Consumer Confidence Index.
Pending Home Sales Index: The Pending Home Sales Index (PHS), a leading indicator of housing activity, measures housing contract activity, and is based on signed real estate contracts for existing single-family homes, condos, and co-ops. Because a home goes under contract a month or two before it is sold, the Pending Home Sales Index generally leads Existing-Home Sales by a month or two.
DISCLOSURES
Import Price Index: The import price index measure price changes in goods or services purchased from abroad by
U.S. residents (imports) and sold to foreign buyers (exports). The indexes are updated once a month by the Bureau of Labor Statistics (BLS) International Price Program (IPP).
ISM New Orders Index: ISM New Order Index shows the number of new orders from customers of manufacturing firms reported by survey respondents compared to the previous month.ISM Employment Index: The ISM Manufacturing Employment Index is a component of the Manufacturing Purchasing Managers Index and reflects employment changes from industrial companies.
ISM Inventories Index: The ISM manufacturing index is a composite index that gives equal weighting to new orders, production, employment, supplier deliveries, and inventories.
ISM Production Index: The ISM manufacturing index or PMI measures the change in production levels across the
U.S. economy from month to month.
ISM Services PMI Index: The Institute of Supply Management (ISM) Non-Manufacturing Purchasing Managers' Index (PMI) (also known as the ISM Services PMI) report on Business, a composite index is calculated as an indicator of the overall economic condition for the non-manufacturing sector.
Source: FactSet, data as of 12/29/2022
