Chief Economist Eugenio J. Alemán discusses current economic conditions.
To say that inflation data during the first quarter of the year surprised us and the markets is clearly an understatement and by Tuesday of this week, with the higher-than-expected Producer Price Index (PPI) print for April, markets were clearly on edge as they were also potentially expecting a higher reading for the Consumer Price Index (CPI) on Wednesday. However, markets popped on Wednesday after a weaker than expected inflation number, up 0.3% compared to market expectations for a 0.4% print. Still, the core CPI came in as expected, up 0.3%, which means that core prices need to continue to come down. But we know that markets like something that is in line with expectations, while, at the same time, love that headline CPI inflation came in lower than expectations. On Thursday, we got the Import Price Index, showing a very strong, 0.9%, increase in import prices. Thus, the CPI showed little evidence of a strong pass-through from either import or producer prices into consumer prices, which could be telling if sustained over the medium term, as it would support our view that consumer demand is weakening.
Wednesday also gave us the first look at consumer demand during the first month of the second quarter as we got retail and food services sales, which came in flat in April compared to March. Within this measure, we also got what is called control group sales, which showed a decline in April, down 0.3%. Although the weaker than expected number for headline retail and food services sales was important, the most important information we got from the retail and food services sales report was the negative reading for control group sales as well as the downward revisions to control group sales during the first quarter of 2024 (see our CPI economic release on page 5).
This tends to point to a weaker performance by consumers during the first quarter of the year compared to what was reported in the release of the first estimate for Q1 2024 GDP. But, and more important, it also calls into question the strength in pricing pressures during the first quarter.
Although we are not going to go out on a limb and argue that the first quarter inflation numbers are wrong or incorrect, it is clear that something doesn’t seem right, and our best guess is that the numbers may be affected by the process by which prices are adjusted to reflect seasonal behavior, that is, the seasonal adjustment process.
At this point we seem to have confirmation that consumer demand was relatively weak during the first quarter, but prices accelerated at the same time, which under current money supply conditions, is very difficult to understand. Furthermore, April’s lower than expected CPI report after such strong PPI and Import Price reports gives further credence to relatively weak consumer demand during the first quarter of the year as well as during the first month of the second quarter. Of course, we will have to wait to be sure, but the probability of having very weak price pressures during the second quarter of the year has increased.
For the Federal Reserve (Fed) this is important information because if we see this happening, it must see the same issues. The Fed is not going to base monetary policy on data that seems to be pointing to issues in measurement rather than to what is really happening in the economy.
Having said this, it is still true that the profile for inflation for the rest of the year remains challenging unless we see a much stronger deceleration in monthly inflation measures, which may be difficult but not impossible if consumer demand continues to weaken. However, a 2.5% or 2.6% rate of inflation for the PCE price index for the rest of the year is not going to make Fed officials change their view on the path of monetary policy.
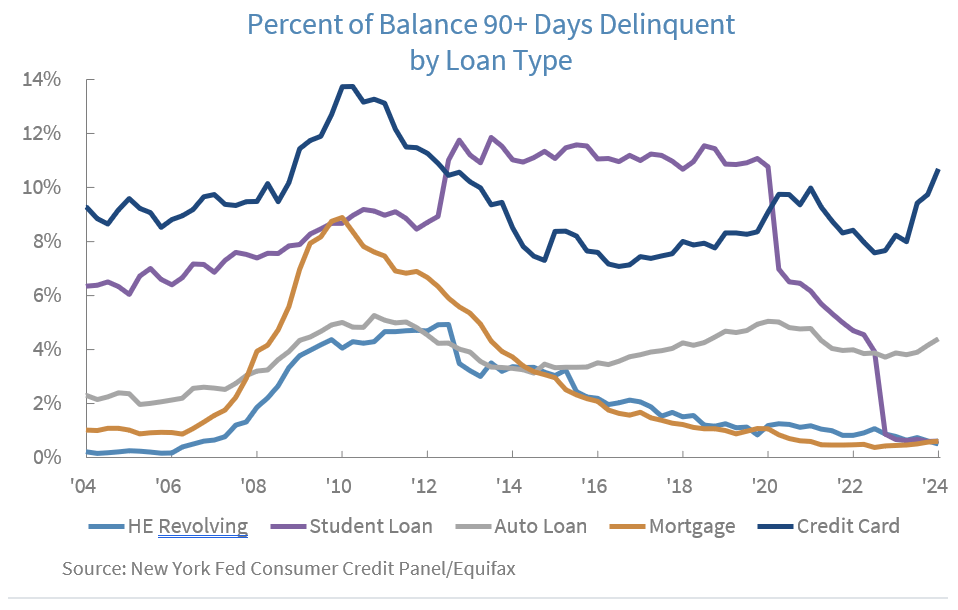
The Federal Reserve Bank of New York (NYFED) released its Household Debt and Credit Report (HD&CR) for the first quarter of 2024 earlier this week. The report continued to show deterioration in some credit delinquency measures, especially for credit cards and auto loans. Furthermore, an analysis of the data on credit cards by NYFED economists also points out that credit card delinquency rates have been rising quickly especially for what they call ‘maxed-out borrowers.’ They define ‘maxed-out borrowers’ as those using more than 90% of their credit limit, which makes sense because those are probably the consumers more stretched in terms of income versus expenditures in the current environment.1
The HD&CR shows the percent of balances 90+ days delinquent by type of loans increasing for credit cards to a level higher than what existed before the pandemic recession while auto loan delinquency rates are still below the pre-pandemic levels but closing in on those higher levels, as the graph below shows.
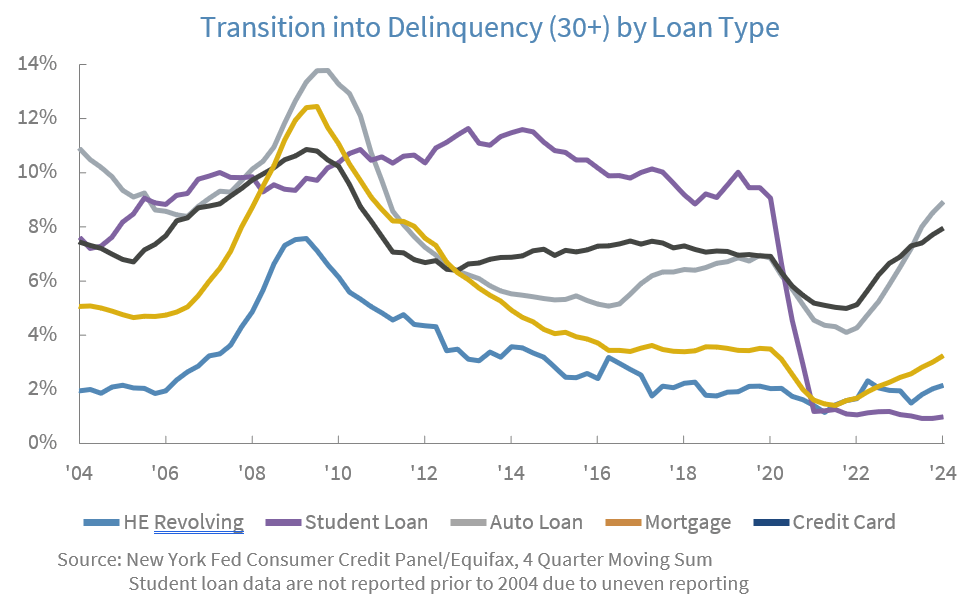
But perhaps the most concerning picture in terms of delinquency by type of credit is that of transition into delinquency (30+), which continued to move higher for almost all types of loans with the exception of student loans, as the graph below shows. Still, transition into delinquency (30+) by loan type is still very low for mortgages as well as for Home Equity Line of Credit (HELOC) compared to previous periods, but delinquency has increased considerably for auto loans as well as credit card loans, which tends to indicate that credit conditions will probably continue to deteriorate in the coming quarters.
Source: New York Fed Consumer Credit Panel/Equifax, 4 Quarter Moving Sum Student loan data are not reported prior to 2004 due to uneven reporting
We will continue to follow these trends as the year progresses to weigh the potential implications for consumer demand as well as for the overall U.S. economy, but it is clear that interest rates have continued to make inroads and while it has taken a very long time, are finally having an impact on economic activity. This is also something that Fed officials are very aware of.
Economic and market conditions are subject to change.
Opinions are those of Investment Strategy and not necessarily those of Raymond James and are subject to change without notice. The information has been obtained from sources considered to be reliable, but we do not guarantee that the foregoing material is accurate or complete. There is no assurance any of the trends mentioned will continue or forecasts will occur. Last performance may not be indicative of future results.
Consumer Price Index is a measure of inflation compiled by the US Bureau of Labor Statistics. Currencies investing is generally considered speculative because of the significant potential for investment loss. Their markets are likely to be volatile and there may be sharp price fluctuations even during periods when prices overall are rising.
Consumer Sentiment is a consumer confidence index published monthly by the University of Michigan. The index is normalized to have a value of 100 in the first quarter of 1966. Each month at least 500 telephone interviews are conducted of a contiguous United States sample.
Personal Consumption Expenditures Price Index (PCE): The PCE is a measure of the prices that people living in the United States, or those buying on their behalf, pay for goods and services. The change in the PCE price index is known for capturing inflation (or deflation) across a wide range of consumer expenses and reflecting changes in consumer behavior.
The Consumer Confidence Index (CCI) is a survey, administered by The Conference Board, that measures how optimistic or pessimistic consumers are regarding their expected financial situation. A value above 100 signals a boost in the consumers’ confidence towards the future economic situation, as a consequence of which they are less prone to save, and more inclined to consume. The opposite applies to values under 100.
Certified Financial Planner Board of Standards Inc. owns the certification marks CFP®, CERTIFIED FINANCIAL PLANNER™, CFP® (with plaque design) and CFP® (with flame design) in the U.S., which it awards to individuals who successfully complete CFP Board's initial and ongoing certification requirements.
Links are being provided for information purposes only. Raymond James is not affiliated with and does not endorse, authorize or sponsor any of the listed websites or their respective sponsors. Raymond James is not responsible for the content of any website or the collection or use of information regarding any website's users and/or members.
GDP Price Index: A measure of inflation in the prices of goods and services produced in the United States. The gross domestic product price index includes the prices of U.S. goods and services exported to other countries. The prices that Americans pay for imports aren't part of this index.
The Conference Board Leading Economic Index: Intended to forecast future economic activity, it is calculated from the values of ten key variables.
The Conference Board Coincident Economic Index: An index published by the Conference Board that provides a broad-based measurement of current economic conditions.
The Conference Board lagging Economic Index: an index published monthly by the Conference Board, used to confirm and assess the direction of the economy's movements over recent months.
The U.S. Dollar Index is an index of the value of the United States dollar relative to a basket of foreign currencies, often referred to as a basket of U.S. trade partners' currencies. The Index goes up when the U.S. dollar gains "strength" when compared to other currencies.
The FHFA House Price Index (FHFA HPI®) is a comprehensive collection of public, freely available house price indexes that measure changes in single-family home values based on data from all 50 states and over 400 American cities that extend back to the mid-1970s.
Import Price Index: The import price index measure price changes in goods or services purchased from abroad by U.S. residents (imports) and sold to foreign buyers (exports). The indexes are updated once a month by the Bureau of Labor Statistics (BLS) International Price Program (IPP).
ISM New Orders Index: ISM New Order Index shows the number of new orders from customers of manufacturing firms reported by survey respondents compared to the previous month. ISM Employment Index: The ISM Manufacturing Employment Index is a component of the Manufacturing Purchasing Managers Index and reflects employment changes from industrial companies.
ISM Inventories Index: The ISM manufacturing index is a composite index that gives equal weighting to new orders, production, employment, supplier deliveries, and inventories.
ISM Production Index: The ISM manufacturing index or PMI measures the change in production levels across the U.S. economy from month to month.
ISM Services PMI Index: The Institute of Supply Management (ISM) Non-Manufacturing Purchasing Managers' Index (PMI) (also known as the ISM Services PMI) report on Business, a composite index is calculated as an indicator of the overall economic condition for the non-manufacturing sector.
Consumer Price Index (CPI) A consumer price index is a price index, the price of a weighted average market basket of consumer goods and services purchased by households. Changes in measured CPI track changes in prices over time.
Producer Price Index: A producer price index (PPI) is a price index that measures the average changes in prices received by domestic producers for their output.
Industrial production: Industrial production is a measure of output of the industrial sector of the economy. The industrial sector includes manufacturing, mining, and utilities. Although these sectors contribute only a small portion of gross domestic product, they are highly sensitive to interest rates and consumer demand.
The NAHB/Wells Fargo Housing Opportunity Index (HOI) for a given area is defined as the share of homes sold in that area that would have been affordable to a family earning the local median income, based on standard mortgage underwriting criteria.
The S&P CoreLogic Case-Shiller U.S. National Home Price NSA Index measures the change in the value of the U.S. residential housing market by tracking the purchase prices of single-family homes.
The S&P CoreLogic Case-Shiller 20-City Composite Home Price NSA Index seeks to measures the value of residential real estate in 20 major U.S. metropolitan.
Source: FactSet, data as of 7/7/2023