Chief Economist Eugenio J. Alemán discusses current economic conditions.
October news on CPI inflation was all the doctor recommended and has markets spinning and repricing the Federal Reserve’s (Fed) potential path forward. That is, markets are already assuming that the Fed is closer to lowering interest rates than what they feared just a month ago when the yield on the 10-year Treasury briefly surpassed 5.0%. Since then, yields have moved back down to about 4.5% and continue to trend lower.
The market expects (at 100%, according to the CME FedWatch tool) the Fed to be done increasing interest rates this year and are already pricing in lower rates starting in May of 2024. But as we have said previously, what is happening, once again, is just the opposite of what Fed officials would like to see and underscores Fed Chairman’s Powell argument during the press conference after the November Federal Open Market Committee (FOMC) decision to keep interest rates unchanged that the institution was not confident of having done enough to keep inflation on a downward trajectory.
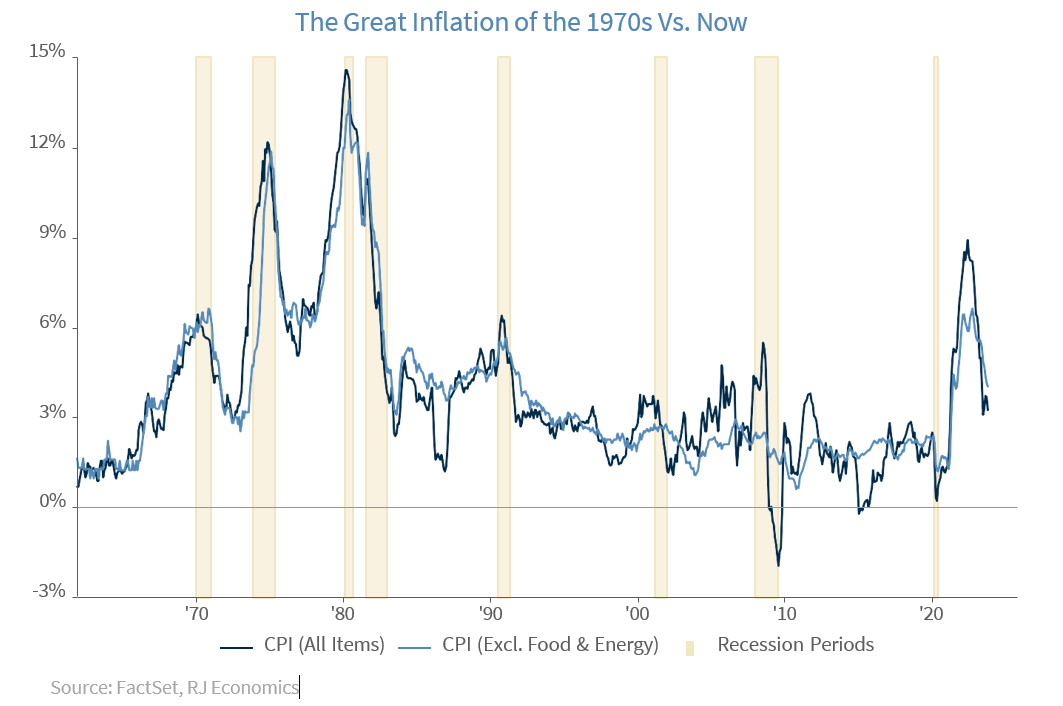
The Fed Chairman is probably trying to be very cautious as experience has shown that if the Fed relaxes monetary policy too soon or too fast, the probability that inflation starts to move higher again, as happened during the 1960s, 1970s and early 1980s, could come back and haunt them, and it is not willing to risk going that route again. This is the reason why the Fed has been very clear that it expects to keep interest rates higher for longer.
The biggest fear for the Fed today is oil prices skyrocketing again due to several potential exogenous shocks, such as a new conflict outside the U.S., just pick any of the following: a war between China and Taiwan, an intensification of current conflicts between Ukraine and Russia and/or between Israel and Hamas, severe climate events across the global economy due to the El Niño effect, etc.
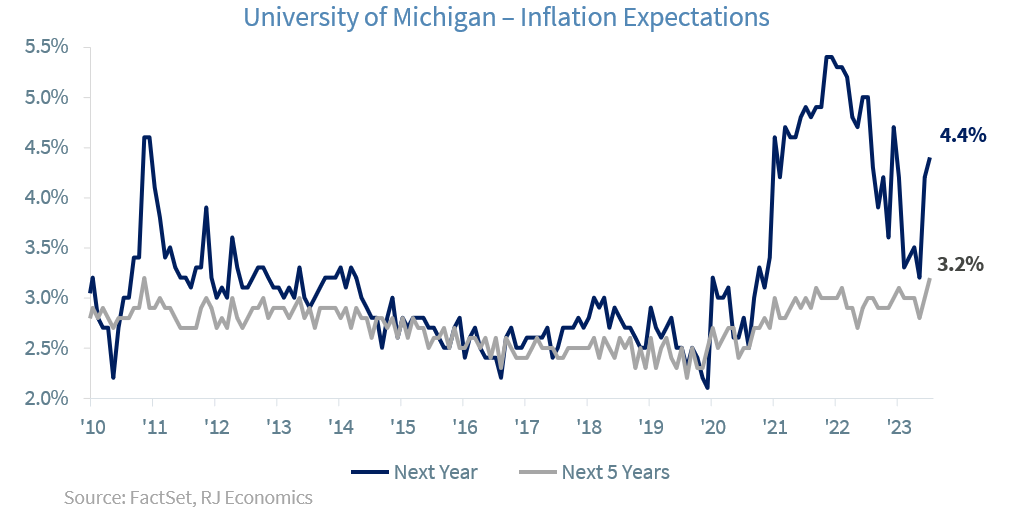
Any geopolitical or natural event mentioned above could send oil and/or food prices much higher and unsettle inflationary expectations, as we have seen during the last several years. In fact, inflationary expectations, as measured by the University of Michigan’s Index, have moved considerably higher (see graph below), both one-year-ahead as well as five-years-ahead, and this is not what the Fed wants to see. Hopefully, lower gasoline prices in October and November will help bring down these inflationary expectations, but there is no assurance that this is going to be the case in the future and that it can be sustained in the medium to long term. Thus, the Fed is not going to risk unsettling inflationary expectations further and will probably keep interest rates high for longer until it is convinced that inflation has settled down to the 2% target rate, and that is still a work in progress.
While risk rating agencies play an important role in keeping financial markets abreast of the potential risks facing economies, they have missed too many developments in the past. Moody’s recently moved the rating outlook on U.S. debt to negative. In fact, this recent move by Moody’s, which is, typically, a harbinger of a ratings downgrade, did not register in any indicator and seems to have been a non-event.
Still, if Moody’s finally downgrades the U.S. debt, it will be the third such move by one of the major risk rating agencies and will come 12 years after Standards & Poor’s downgraded U.S. debt and several months after Fitch did the same thing.
We are not saying that the U.S. debt issues are not important today, especially compared to 12 years ago, but we wonder why Standards & Poor’s downgraded U.S. debt ratings when the U.S. debt was at about
$14 trillion, which seems to have been an exaggeration, considering that interest rates were still low during that period and there was almost no risk of non-payment by the U.S.
Perhaps the only answer to why they did it is something that has remained unchanged from those days. At the time, they argued that they did not downgrade the U.S. debt because the U.S. was not able to pay, but because the political system’s disarray was such that there was no willingness to put the house in order so it could honor its commitments. That has definitely not changed today compared to what was happening back in 2011. However, the debt is now approaching $34 trillion and the interest rate on the debt is increasing considerably and pushing interest payments on the debt to new heights, thus requiring the U.S. government to make even tougher decisions regarding the budget at a time when the political system’s disarray has probably worsened compared to 2011.
While the U.S. debt has increased considerably over the last several years, especially due to the efforts during the Great Recession and the efforts to minimize the effects of the COVID-19 pandemic, the ability to pay these higher interest rates is still intact. The problem is that the willingness to make the tough choices to make this happen is being threatened by the continuous U.S. political system disarray. At least the Standards & Poor’s decision in 2011 had this argument correct, even if the decision to downgrade the U.S. debt was probably not the correct one.
Economic and market conditions are subject to change.
Opinions are those of Investment Strategy and not necessarily those of Raymond James and are subject to change without notice. The information has been obtained from sources considered to be reliable, but we do not guarantee that the foregoing material is accurate or complete. There is no assurance any of the trends mentioned will continue or forecasts will occur. Last performance may not be indicative of future results.
Consumer Price Index is a measure of inflation compiled by the US Bureau of Labor Statistics. Currencies investing is generally considered speculative because of the significant potential for investment loss. Their markets are likely to be volatile and there may be sharp price fluctuations even during periods when prices overall are rising.
Consumer Sentiment is a consumer confidence index published monthly by the University of Michigan. The index is normalized to have a value of 100 in the first quarter of 1966. Each month at least 500 telephone interviews are conducted of a contiguous United States sample.
Personal Consumption Expenditures Price Index (PCE): The PCE is a measure of the prices that people living in the United States, or those buying on their behalf, pay for goods and services. The change in the PCE price index is known for capturing inflation (or deflation) across a wide range of consumer expenses and reflecting changes in consumer behavior.
The Consumer Confidence Index (CCI) is a survey, administered by The Conference Board, that measures how optimistic or pessimistic consumers are regarding their expected financial situation. A value above 100 signals a boost in the consumers’ confidence towards the future economic situation, as a consequence of which they are less prone to save, and more inclined to consume. The opposite applies to values under 100.
Certified Financial Planner Board of Standards Inc. owns the certification marks CFP®, CERTIFIED FINANCIAL PLANNER™, CFP® (with plaque design) and CFP® (with flame design) in the U.S., which it awards to individuals who successfully complete CFP Board's initial and ongoing certification requirements.
Links are being provided for information purposes only. Raymond James is not affiliated with and does not endorse, authorize or sponsor any of the listed websites or their respective sponsors. Raymond James is not responsible for the content of any website or the collection or use of information regarding any website's users and/or members.
GDP Price Index: A measure of inflation in the prices of goods and services produced in the United States. The gross domestic product price index includes the prices of U.S. goods and services exported to other countries. The prices that Americans pay for imports aren't part of this index.
The Conference Board Leading Economic Index: Intended to forecast future economic activity, it is calculated from the values of ten key variables.
The Conference Board Coincident Economic Index: An index published by the Conference Board that provides a broad-based measurement of current economic conditions.
The Conference Board lagging Economic Index: an index published monthly by the Conference Board, used to confirm and assess the direction of the economy's movements over recent months.
The U.S. Dollar Index is an index of the value of the United States dollar relative to a basket of foreign currencies, often referred to as a basket of U.S. trade partners' currencies. The Index goes up when the U.S. dollar gains "strength" when compared to other currencies.
The FHFA House Price Index (FHFA HPI®) is a comprehensive collection of public, freely available house price indexes that measure changes in single-family home values based on data from all 50 states and over 400 American cities that extend back to the mid-1970s.
Import Price Index: The import price index measure price changes in goods or services purchased from abroad by U.S. residents (imports) and sold to foreign buyers (exports). The indexes are updated once a month by the Bureau of Labor Statistics (BLS) International Price Program (IPP).
ISM New Orders Index: ISM New Order Index shows the number of new orders from customers of manufacturing firms reported by survey respondents compared to the previous month. ISM Employment Index: The ISM Manufacturing Employment Index is a component of the Manufacturing Purchasing Managers Index and reflects employment changes from industrial companies.
ISM Inventories Index: The ISM manufacturing index is a composite index that gives equal weighting to new orders, production, employment, supplier deliveries, and inventories.
ISM Production Index: The ISM manufacturing index or PMI measures the change in production levels across the U.S. economy from month to month.
ISM Services PMI Index: The Institute of Supply Management (ISM) Non-Manufacturing Purchasing Managers' Index (PMI) (also known as the ISM Services PMI) report on Business, a composite index is calculated as an indicator of the overall economic condition for the non-manufacturing sector.
Consumer Price Index (CPI) A consumer price index is a price index, the price of a weighted average market basket of consumer goods and services purchased by households. Changes in measured CPI track changes in prices over time.
Producer Price Index: A producer price index (PPI) is a price index that measures the average changes in prices received by domestic producers for their output.
Industrial production: Industrial production is a measure of output of the industrial sector of the economy. The industrial sector includes manufacturing, mining, and utilities. Although these sectors contribute only a small portion of gross domestic product, they are highly sensitive to interest rates and consumer demand.
The NAHB/Wells Fargo Housing Opportunity Index (HOI) for a given area is defined as the share of homes sold in that area that would have been affordable to a family earning the local median income, based on standard mortgage underwriting criteria.
The S&P CoreLogic Case-Shiller U.S. National Home Price NSA Index measures the change in the value of the U.S. residential housing market by tracking the purchase prices of single-family homes.
The S&P CoreLogic Case-Shiller 20-City Composite Home Price NSA Index seeks to measures the value of residential real estate in 20 major U.S. metropolitan.
Source: FactSet, data as of 7/7/2023