
Better tariff news, but uncertainty to limit potential benefits near term
Chief Economist Eugenio J. Alemán discusses current economic conditions.
We know that many shops are changing their view on economic activity due to the partial about-face regarding US-China tariffs, going from 145% to “just” 30%, but a 90-day window does not give comfort to either consumers or businesses. Our current forecast includes a recovery in economic activity during the second quarter of the year on account of a still relatively strong domestic economy and a reduced negative effect from net exports compared to what we saw during the first quarter of the year. However, with the new decision to lower tariffs rates from 145% to 30% for 90 days on imports from China, firms are still in a bind. Would they want to continue to increase purchases from outside (imports) to continue to build inventories and lower the average cost of imports during the second quarter or would they want to wait for a while longer to see if the tariffs are brought down further during the next 90 days?
This question doesn’t have an easy answer and will probably depend on the type of industry/sector. Thus, the economic forecast will depend on the final decision. For that, we will have to wait until May’s trade data is released on July 3rd to see how firms responded to the decision to lower tariffs on China to 30%. Thus, for now, we are not changing our economic growth forecast and will wait for more certainty on the path forward.
Disinflation remained intact in April while consumers were discerning
Despite a stronger than expected increase in shelter prices in April, up 0.3% compared to a 0.2% increase in March, price pressures across the US economy continued to abate, with the year-over-year Consumer Price Index (CPI) slowing down further to 2.3% in April, compared to a rate of 2.4% for the year ending in March. Shelter prices remained almost unchanged on a year-over-year basis at 4.0%. According to the CPI report, the increase in shelter prices during the month of April represented more than 50% of the increase in the headline CPI. At the same time, although the price of energy commodities, i.e., gasoline prices and fuel oil prices, declined during the month, higher natural gas and electricity prices pushed overall energy prices higher by 0.7%.
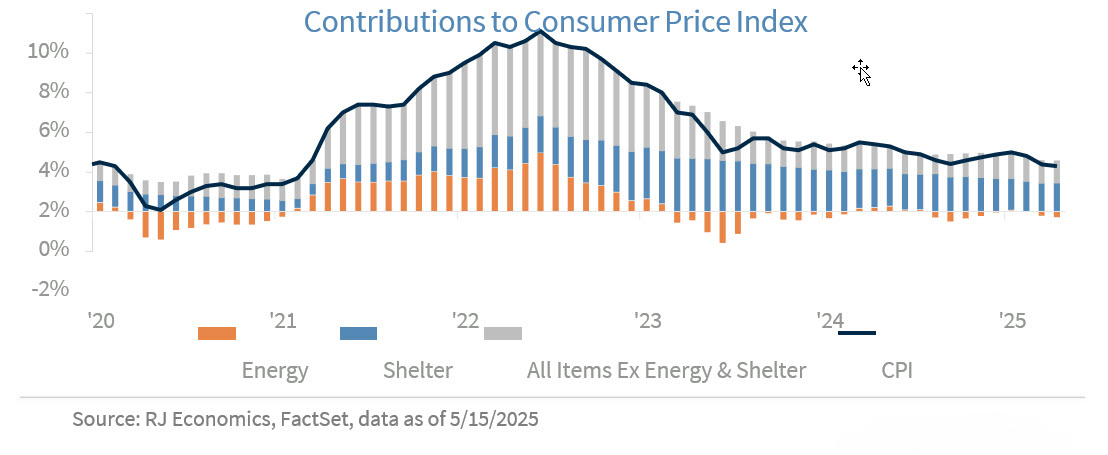
Food prices were also weak in April, as food at home prices declined by 0.4%. But some of the weakness in April was due to a very strong food at home prices print in March of this year, which is probably related to seasonal/calendar patterns as Americans probably increased food at home purchases in March to prepare for Easter in April. At the same time, there was a large decline in eggs prices, down 12.7% month-on- month, which helped bring food prices down further during the month of April.
Food away from home prices increased by 0.4%, month-on-month, consistent with Thursday’s retail and food services report, which showed a strong, back-to-back, increase in sales at food services & drinking places stores, i.e., restaurants, in March and April. Sales at these stores increased by 1.2%, month-on- month in April, after surging by 3.0% in March. Sales at food services & drinking places stores were up 7.8% on a year earlier basis in April.
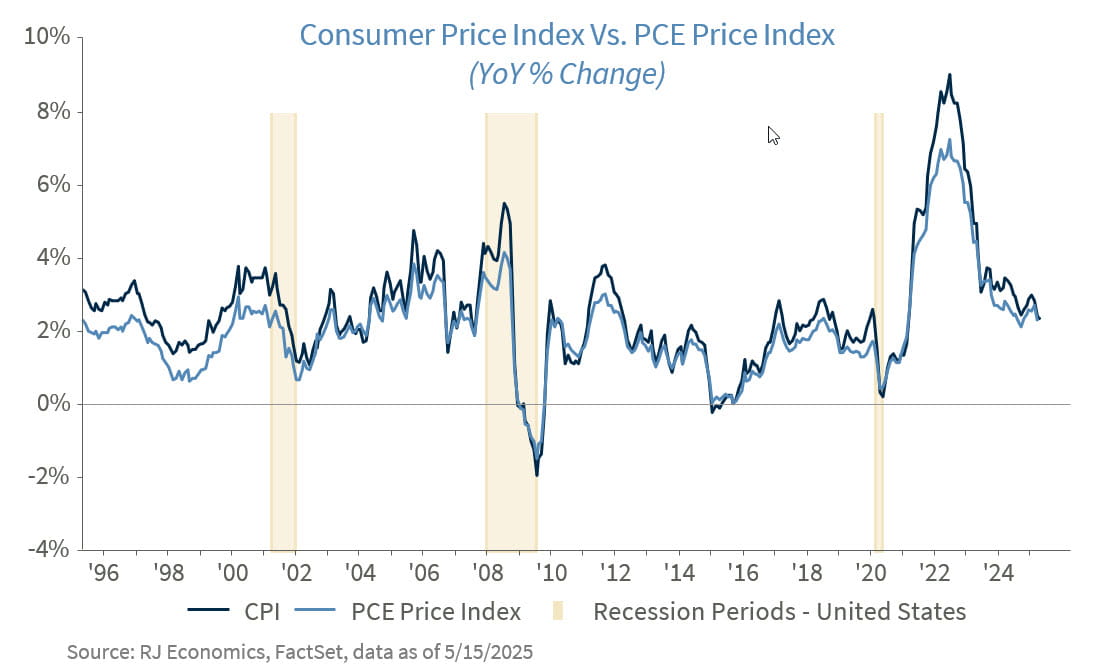
CPI inflation came very close to the 2.0% target in April, at 2.3%, even though the target is for the PCE price index and not the CPI price index. However, we expect the PCE price index to slow down further, to 2.2% on a year-over-year basis in April. This will be the last disinflationary month for several months as we expect base effects as well as price increases from tariffs to start showing up in inflation numbers starting in June.
Although the month-on-month picture for total retail and food services sales were not that strong in April, it came after a very strong month in March. At the same time, every sector of retail and food services sales were up strongly compared to the previous year, except sales at gasoline stations, which were down 6.8% on a year-over-year basis just because gasoline prices were down by 12.2% during the same period. The other exception was the department stores subsector, which declined by 1.4% on a month-on-month basis and was down by 3.4% compared to April of last year.
The fact that so many sectors of retail showed positive prints in April after such a strong performance in March shows that consumers remained engaged in the economy during the month of April, probably still front-loading any future tariff impact. This was especially the case with building materials and garden equipment and supplies dealers' sales, which increased by a strong 0.8% after surging by 2.9% on a month-over-month basis in March. However, we also saw a highly discerning consumer, still going out to eat at restaurants while taking advantage of much lower gasoline prices compared to last year.
In summary, the inflation and retail sales news this month were positive but the prospects for improvement going forward on both sides remain in doubt due to still-high levels of uncertainty regarding the future of tariffs and the impact on prices as well as economic activity.
Economic and market conditions are subject to change.
Opinions are those of Investment Strategy and not necessarily those of Raymond James and are subject to change without notice. The information has been obtained from sources considered to be reliable, but we do not guarantee that the foregoing material is accurate or complete. There is no assurance any of the trends mentioned will continue or forecasts will occur. Past performance may not be indicative of future results.
Consumer Price Index is a measure of inflation compiled by the US Bureau of Labor Statistics. Currencies investing is generally considered speculative because of the significant potential for investment loss. Their markets are likely to be volatile and there may be sharp price fluctuations even during periods when prices overall are rising.
Consumer Sentiment is a consumer confidence index published monthly by the University of Michigan. The index is normalized to have a value of 100 in the first quarter of 1966. Each month at least 500 telephone interviews are conducted of a contiguous United States sample.
Personal Consumption Expenditures Price Index (PCE): The PCE is a measure of the prices that people living in the United States, or those buying on their behalf, pay for goods and services. The change in the PCE price index is known for capturing inflation (or deflation) across a wide range of consumer expenses and reflecting changes in consumer behavior.
The Consumer Confidence Index (CCI) is a survey, administered by The Conference Board, that measures how optimistic or pessimistic consumers are regarding their expected financial situation. A value above 100 signals a boost in the consumers’ confidence towards the future economic situation, as a consequence of which they are less prone to save, and more inclined to consume. The opposite applies to values under 100.
Certified Financial Planner Board of Standards Center for Financial Planning, Inc. owns and licenses the certification marks CFP®, CERTIFIED FINANCIAL PLANNER®, and CFP® (with plaque design) in the United States to Certified Financial Planner Board of Standards, Inc., which authorizes individuals who successfully complete the organization’s initial and ongoing certification requirements to use the certification marks.
Links are being provided for information purposes only. Raymond James is not affiliated with and does not endorse, authorize or sponsor any of the listed websites or their respective sponsors. Raymond James is not responsible for the content of any website or the collection or use of information regarding any website's users and/or members.
GDP Price Index: A measure of inflation in the prices of goods and services produced in the United States. The gross domestic product price index includes the prices of U.S. goods and services exported to other countries. The prices that Americans pay for imports aren't part of this index.
Employment cost Index: The Employment Cost Index (ECI) measures the change in the hourly labor cost to employers over time. The ECI uses a fixed “basket” of labor to produce a pure cost change, free from the effects of workers moving between occupations and industries and includes both the cost of wages and salaries and the cost of benefits.
US Dollar Index: The US Dollar Index is an index of the value of the United States dollar relative to a basket of foreign currencies, often referred to as a basket of U.S. trade partners' currencies. The Index goes up when the
U.S. dollar gains "strength" when compared to other currencies.
Import Price Index: The import price index measure price changes in goods or services purchased from abroad by U.S. residents (imports) and sold to foreign buyers (exports). The indexes are updated once a month by the Bureau of Labor Statistics (BLS) International Price Program (IPP).
ISM Services PMI Index: The Institute of Supply Management (ISM) Non-Manufacturing Purchasing Managers' Index (PMI) (also known as the ISM Services PMI) report on Business, a composite index is calculated as an indicator of the overall economic condition for the non-manufacturing sector.
Consumer Price Index (CPI) A consumer price index is a price index, the price of a weighted average market basket of consumer goods and services purchased by households.
Producer Price Index: A producer price index(PPI) is a price index that measures the average changes in prices received by domestic producers for their output.
Industrial production: Industrial production is a measure of output of the industrial sector of the economy. The industrial sector includes manufacturing, mining, and utilities. Although these sectors contribute only a small portion of gross domestic product, they are highly sensitive to interest rates and consumer demand.
The NAHB/Wells Fargo Housing Opportunity Index (HOI) for a given area is defined as the share of homes sold in that area that would have been affordable to a family earning the local median income, based on standard mortgage underwriting criteria.
Conference Board Coincident Economic Index: The Composite Index of Coincident Indicators is an index published by the Conference Board that provides a broad-based measurement of current economic conditions, helping economists, investors, and public policymakers to determine which phase of the business cycle the economy is currently experiencing.
Conference Board Lagging Economic Index: The Composite Index of Lagging Indicators is an index published monthly by the Conference Board, used to confirm and assess the direction of the economy's movements over recent months.
New Export Index: The PMI New export orders index allows us to track international demand for a country's goods and services on a timely, monthly, basis.
Gold is subject to the special risks associated with investing in precious metals, including but not limited to: price may be subject to wide fluctuation; the market is relatively limited; the sources are concentrated in countries that have the potential for instability; and the market is unregulated.
The Conference Board Leading Economic Index: Intended to forecast future economic activity, it is calculated from the values of ten key variables.
Source: FactSet, data as of 12/6/2024
