
The Week in Review: 03/17/25
“Everybody in the world is a long-term investor until the market goes down.” – Peter Lynch
Good Morning,
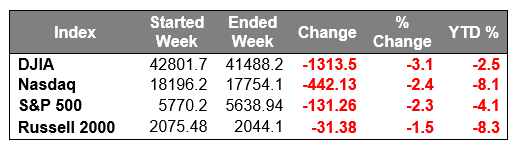
It was another disappointing week for stocks. The market has been in a downtrend for a few weeks based on growth concerns and tariff fears, which continued last week. The S&P 500 broke below its 200-day moving average and entered correction territory (i.e. 10% from its February 19 high) while the Nasdaq Composite extended its decline in correction territory.
Right out of the gate on Monday, fears about economic growth percolated after President Trump said in an interview the previous weekend that the economy is going through a "period of transition" and he declined to answer directly if the U.S. will experience a recession.
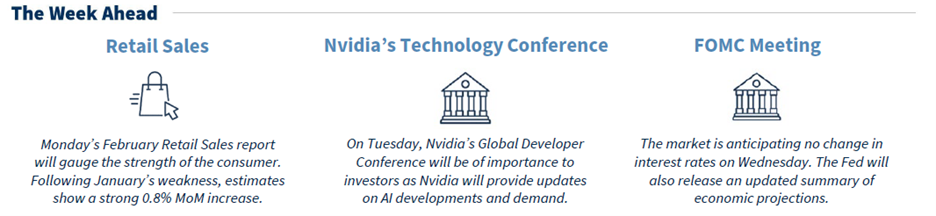
Trade war tensions increased after President Trump announced that the US will impose a 50% tariff on Canadian steel and aluminum imports, starting Wednesday, instead of the originally proposed 25%.
The escalation followed a retaliatory measure by Ontario, which imposed a 25% tariff on exports of electricity to the U.S. in response to the originally planned 25% tariffs on Canadian imports.
President Donald Trump also announced a potential 200% tariff on European beverage imports, including wines and spirits. This move was in response to the European Union's recent tariffs on American whiskey.
Historically, corrections have led to rewarding recoveries.
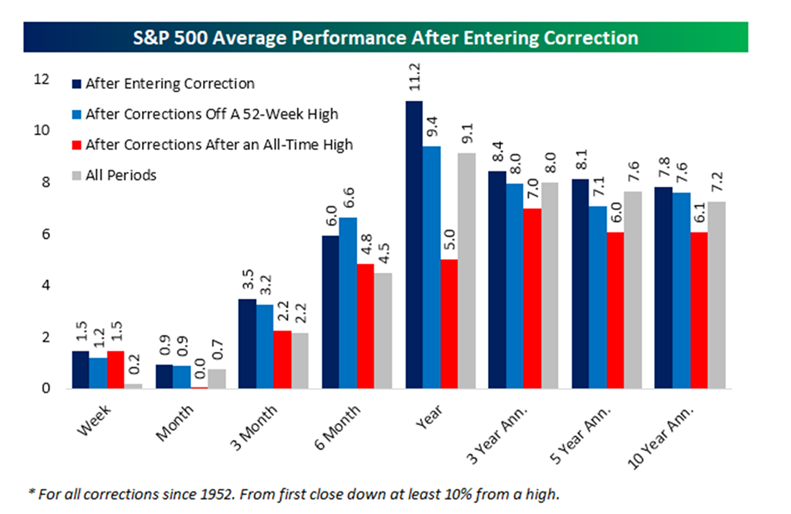
Source: Bespoke Investment Group
This has been the swiftest correction in 75 years, leaving investors most anxious.
Fear is high!
Last week was a lesson in volatility, allowing us to dip into “correction” (-10%) territory for a brief period.
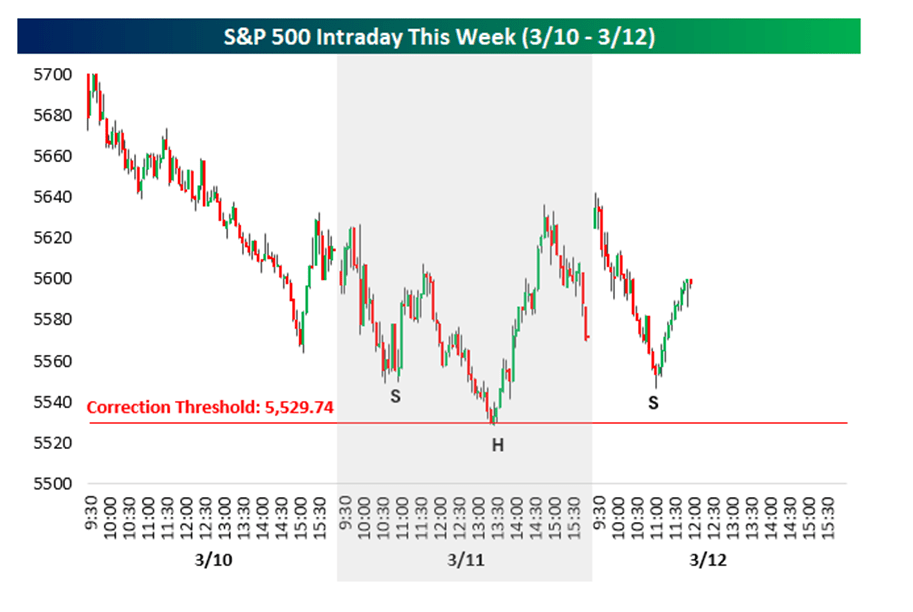
Source: Bespoke Investment Group
I put quite a bit of value in Technical Analysis…
This chart has a strong resemblance to an inverted “head & Shoulders” formation, which is very often a Bullish pattern.
I am also student of history…
From its close on 2/19 to 3/12, the S&P 500 declined 8.6%. That ranks below the 2nd percentile of all 15-trading day moves since 1953. In prior periods when three-week returns were in the bottom two percentiles of historical returns, the S&P 500’s median 12-month gain was 20.6% with positive returns 83% of the time. (Source: Bespoke Investment Group)
On the economic front…
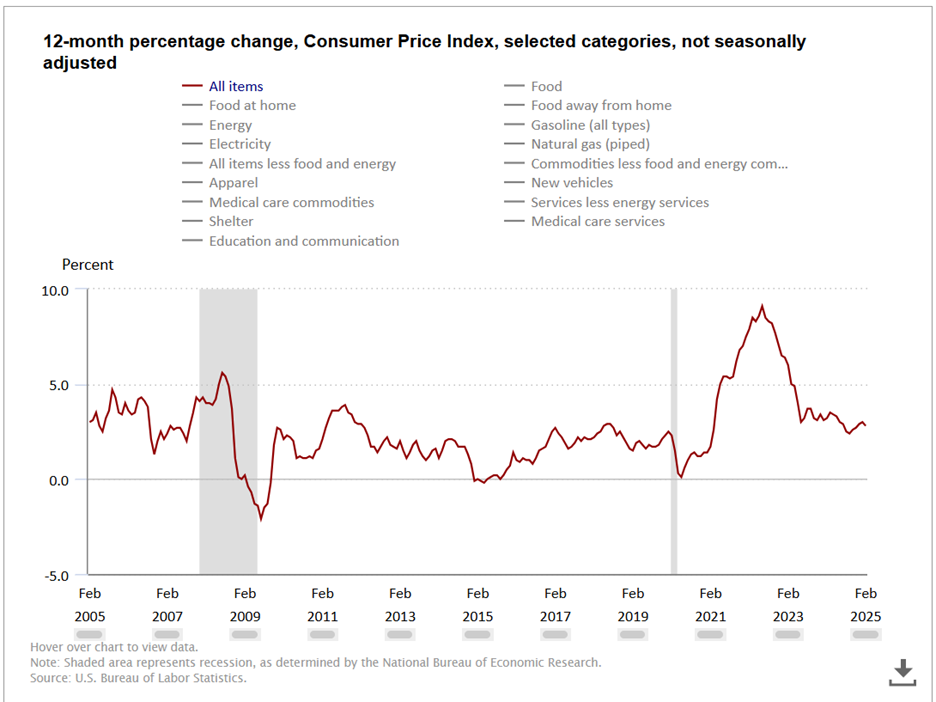
Last week's inflation data was relatively positive, yet the markets didn't respond in kind due to the understanding that inflation remains above the Fed's 2.0% target and trade policy may negatively impact future prints.
The Consumer Price Index (CPI) report for February showed inflation rising at a slower-than-expected pace, providing a measure of relief to markets after last month's hotter-than-expected reading. On a year-over-year basis, total CPI was up 2.8% versus 3.0% in January and core-CPI was up 3.1% versus 3.2% in January. The February Producer Price Index also contained some lower-than-expected headline prints.
Other data last week included a relatively low level of weekly jobless claims, along with a preliminary University of Michigan Index of Consumer Sentiment survey for March, which dropped to 57.9 (consensus 65.6) from the final reading of 64.7 for February, marking the third straight drop in sentiment. In the same period a year ago, the index stood at 79.4.
Mega cap stocks had an outsized impact on the broader equity market.
Only two S&P 500 sectors settled in the green -- energy (+2.6%) and utilities (+1.9%) -- while the consumer staples (-4.3%), consumer discretionary (-3.7%), and communication services (-2.5%) sectors registered the largest declines.
Have a wonderful week!
Michael D. Hilger, CEP®
Managing Director
Senior Vice President, Wealth Management
The opinions expressed herein are those of Michael Hilger and not necessarily those of Raymond James & Associates, Inc., and are subject to change without notice. The information contained in this report does not purport to be a complete description of the securities, markets, or developments referred to in this material. There is no assurance any of the trends mentioned will continue or forecasts will occur. The information has been obtained from sources considered to be reliable, but Raymond James does not guarantee that the foregoing material is accurate or complete. Investing involves risk and you may incur a profit or loss regardless of strategy selected.
The information contained herein is general in nature and does not constitute legal or tax advice. Inclusion of these indexes is for illustrative purposes only. Keep in mind that individuals cannot invest directly in any index, and index performance does not include transaction costs or other fees, which will affect actual investment performance. Individual investor's results will vary. Past performance does not guarantee future results. The Dow Jones Industrial Average (INDU) is the most widely used indicator of the overall condition of the stock market, a price-weighted average of 30 actively traded blue chip stocks, primarily industrials. The Dow Jones Transportation Average (DJTA, also called the "Dow Jones Transports") is a U.S. stock market index from the Dow Jones Indices of the transportation sector, and is the most widely recognized gauge of the American transportation sector. Standard & Poor's 500 (SPX) is a basket of 500 stocks that are considered to be widely held. The S&P 500 index is weighted by market value, and its performance is thought to be representative of the stock market as a whole. The S&P 500 is an unmanaged index of widely held stocks that is generally representative of the U.S. stock market. Keep in mind that individuals cannot invest directly in any index, and index performance does not include transaction costs and other fees, which will affect investment performance. Individual investor’s results will vary. The NASDAQ Composite Index (COMP.Q) is an index that indicates price movements of securities in the over-the-counter market. It includes all domestic common stocks in the NASDAQ System (approximately 5,000 stocks) and is weighted according to the market value of each listed issue. The NASDAQ-100 (^NDX) is a modified capitalization-weighted index. It is based on exchange, and it is not an index of U.S.-based companies. The Russell 2000 index is an unmanaged index of small cap securities which generally involve greater risks.
The Nasdaq-100 Index includes 100 of the largest domestic and international non-financial companies listed on The Nasdaq Stock Market based on market capitalization. The Index reflects companies across major industry groups including computer hardware and software, telecommunications, retail/wholesale trade and biotechnology. It does not contain securities of financial companies including investment companies.
U.S. government bonds and Treasury notes are guaranteed by the U.S. government and, if held to maturity, offer a fixed rate of return, and guaranteed principal value. U.S. government bonds are issued and guaranteed as to the timely payment of principal and interest by the federal government. Treasury notes are certificates reflecting intermediate-term (2 - 10 years) obligations of the U.S. government.
The companies engaged in business related to a specific sector are subject to fierce competition and their products and services may be subject to rapit obsolescence. There are additional risks associated with investing in an individual sector, including limited diversification.
Dividends are not guaranteed and must be authorized by the company's board of directors.
Diversification does not ensure a profit or guarantee against a loss.
Investing in oil involves special risks, including the potential adverse effects of state and federal regulation and may not be suitable for all investors.
International investing involves special risks, including currency fluctuations, differing financial accounting standards, and possible political and economic volatility.
The companies engaged in the communications and technology industries are subject to fierce competition and their products and services may be subject to rapid obsolescence.
Gold is subject to the special risks associated with investing in precious metals, including but not limited to: price may be subject to wide fluctuation; the market is relatively limited; the sources are concentrated in countries that have the potential for instability; and the market is unregulated.
The information contained within this commercial email has been obtained from sources considered reliable, but we do not guarantee the foregoing material is accurate or complete.
Any information is not a complete summary or statement of all available data necessary for making an investment decision and does not constitute a recommendation. Prior to making an investment decision, please consult with your financial advisor about your individual situation.
Charts are reprinted with permission, further reproduction is strictly prohibited.
