Tariffs, Trade Wars, and Market Volatility: Lessons from History
In times like this, it may be helpful to put today’s headlines and market reactions in historical context. When news of Trump’s new tariffs hit on Wednesday, we finally had the actual numbers to help us try to model its impacts. The problem is the market is still trying to understand if this is a Trump 1.0 negotiating tactic or whether Trump 2.0 is on a very different path. Economists are still trying to understand the math and rationale behind the tariffs. Most importantly, how long the administration will keep them in place. These uncertainties continue to stir market volatility—and investor anxiety. But the past can be a powerful lens to understand the present. And few historical episodes offer a clearer warning than the infamous Smoot-Hawley Tariff Act of 1930.
Passed in the early stages of the Great Depression, the Smoot-Hawley Act raised tariffs on over 20,000 imported goods in an effort to protect American farmers and manufacturers1. It was designed with good intentions—to protect domestic jobs and stabilize the economy—but it backfired spectacularly. Other nations retaliated with tariffs of their own, global trade collapsed, and the economic downturn deepened2. Between 1929 and 1933, world trade fell by more than 60%, and U.S. exports plummeted2. Instead of shielding the economy, protectionist policies prolonged and worsened the downturn.
Fast forward nearly 90 years to the Trump administration’s trade war, and the parallels are hard to miss. Beginning in 2018 during Trump’s first administration, tariffs were imposed on steel, aluminum, and a wide array of Chinese goods3. Just like in the 1930s, the goal was to rebalance trade relationships and support domestic industries. And again, retaliation followed. China and other trading partners levied their own tariffs, targeting American agriculture and manufacturing sectors3. This tit-for-tat escalation injected uncertainty into global markets and strained supply chains. We find ourselves back in the same situation with the new Trump administration seemingly doubling down on tariffs as a way to realign a fully globalized economy back to the U.S., with similar intent to protect American jobs and bring manufacturing back.
The world is much more complex and interconnected than in 1930, however, the effect of tariffs on market psychology and investor behavior has been remarkably similar. In the 1930’s equity markets whipsawed with every trade-related headline. Businesses delayed investment decisions. Investors struggled to make sense of how political decisions would translate to economic outcomes. This is what is happening today as well.
What we often forget is that the market doesn’t fear bad news—it fears uncertainty. Tariffs create an ambiguous environment where future costs, demand, and earnings are hard to forecast. When companies can’t plan, they pause. When investors can’t predict, they pull back.
But here’s the key lesson—markets have been here before. Volatility is not new. Trade disputes are not new. And most importantly, market recoveries are not new either.
In fact, some of the strongest returns in market history have come right after periods of extreme pessimism. That’s not just anecdote—that’s data.
Consider the sentiment statistics: When investor sentiment, measured by indicators like the AAII BullBear Survey or the CBOE Volatility Index (VIX), hits extreme bearish levels, future returns over the next 12 months tend to be significantly above average4. For example, when the VIX spikes above 30 (a sign of extreme fear), the S&P 500 has historically produced double-digit returns over the following year4. And when AAII bearish sentiment exceeds 50%, the one-year forward return for the S&P 500 has averaged well above its long-term norm4.
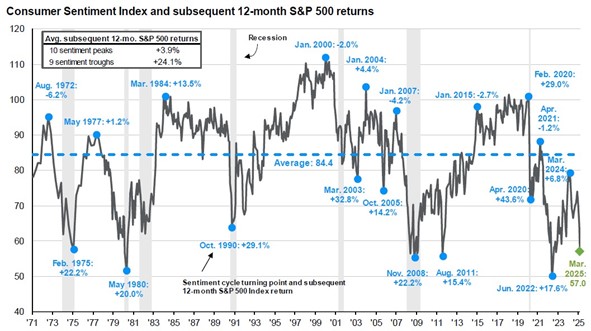

The logic here is simple: markets price in fear quickly, often overshooting to the downside. But just as quickly, they snap back when clarity returns or simply when things are less bad than feared. This was true after the dot-com bubble, after the 2008 financial crisis, and again in the wake of the COVID crash.
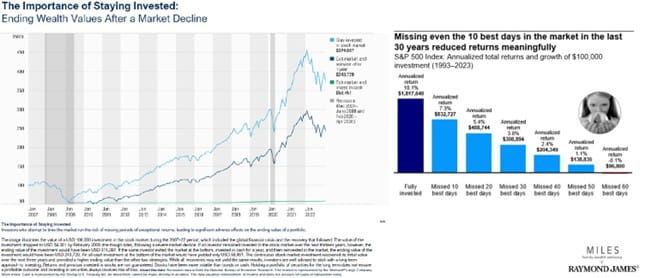
And yet, time and again, investors try to avoid the pain by timing the market—a strategy that sounds appealing in theory but proves devastating in practice.
Missing just the 10 best days in the market over a 20-year period can cut your returns by more than half5. The challenge? Those best days often cluster around the worst ones. In fact, some of the biggest singleday gains in market history have occurred during periods of extreme volatility—right in the middle of market drawdowns5.
Which brings us back to today.
If history is any guide, tariffs and trade conflicts will continue to create noise. Political posturing will generate headlines, and the market will respond with short-term spasms. But over the long term, fundamentals prevail.
As your advisors, our job is to keep you grounded and do our best to remove emotions from the decisionmaking process. Tariffs may impact certain sectors or create short-term disruptions, but they are unlikely to derail long-term wealth creation. Markets are resilient. Investors who stay the course, diversify appropriately, and avoid knee-jerk reactions tend to outperform those who attempt to outguess the news cycle.
So, when clients ask, “Should we be doing something because of tariffs?”—the best answer may be: “Yes. We should be reviewing your long-term plan, confirming when you will need your funds, and making sure your 0-3 year bucket is fully funded and your plan is focused on your future —not the headlines.”
History doesn’t repeat itself, but it often rhymes. From Smoot-Hawley to today, trade tensions may spark fear, but they rarely justify panic. And more often than not, the brightest days come after the darkest weeks.
Let’s stay focused on what we can control—because the real risk isn’t volatility. It’s succumbing to our emotions and missing the recovery.

JOSH J. MILES, CPWA®, BFATM
Managing Director
Private Wealth Advisor
Financial Advisor
Notes:
Smoot-Hawley Tariff Act - Wikipedia
Smoot-Hawley Tariff Act | History, Effects, & Facts | Britannica
Trump announces sweeping new tariffs to promote US manufacturing ...
What We’ve Learned From 150 Years of Stock Market Crashes
List of largest daily changes in the Dow Jones Industrial Average
Historical Context: Smoot-Hawley Tariff Act
S. Department of State – Office of the Historian:
https://history.state.gov/milestones/1921-1936/protectionism
Library of Congress:
“Smoot-Hawley Tariff Act, June 17, 1930”
Impact of Smoot-Hawley on Global Trade
Peterson Institute for International Economics:
https://www.piie.com/blogs/realtime-economics/2024/trumps-proposed-blanket-tariffs-would-risk-global-trade-war
World Trade Organization (WTO) Data:
Used in various academic studies showing the global trade collapse of ~60% post-1930.
Trump Administration Tariffs
Council on Foreign Relations (CFR):
https://www.cfr.org/article/what-trumps-trade-war-would-mean-nine-charts https://www.cfr.org/article/tariffs-will-destroy-best-cure-trade-deficit
Brookings Institution:
https://www.piie.com/blogs/realtime-economics/2025/historic-significance-trumps-tariff-actions
Peterson Institute for International Economics:
https://www.piie.com/blogs/realtime-economics/2025/trumps-tariffs-are-designed-maximum-damage-america
The information contained in this report does not purport to be a complete description of the securities, markets, or developments referred to in this material. The information has been obtained from sources considered to be reliable, but we do not guarantee that the foregoing material is accurate or complete. Any opinions are those of Josh Miles and not necessarily those of Raymond James. Expressions of opinion are as of this date and are subject to change without notice. There is no guarantee that these statements, opinions or forecasts provided herein will prove to be correct. Holding stocks for the long-term does not insure a profitable outcome. Investing involves risk and you may incur a profit or loss regardless of strategy selected, including asset allocation and diversification. This is not a recommendation to purchase or sell the stocks of the companies pictured/mentioned. Past performance does not guarantee future results. Future investment performance cannot be guaranteed, investment yields will fluctuate with market conditions.
The S&P 500 is an unmanaged index of 500 widely held stocks that is generally considered representative of the U.S. stock market. You cannot invest directly in an index. Index returns do not reflect any fees, expense, or sales charges. These returns were the result of certain market factors and events which may not be repeated in the future.
The CBOE Volatility Index® (VIX® Index®) is a key measure of market expectations of near-term volatility conveyed by S&P 500 stock index option prices.
The Dow Jones Industrial Average (DJIA), commonly known as “The Dow” is an index representing 30 stock of companies maintained and reviewed by the editors of the Wall Street Journal.
Private Wealth Advisor is a designation awarded by Raymond James to financial advisors who have demonstrated mastery in anticipating and managing the expansive financial needs of high-net-worth individuals, families and organizations.
