

Market turnaround raises question: Where do we go from here?
Review the latest Weekly Headings by CIO Larry Adam.
Key Takeaways
- Equity rally starting to feel stretched as investor sentiment makes a u-turn
- Do not overlook valuations: S&P 500’s P/E is looking pricey
- Looking ahead, sector differentiation is likely to play a greater role
What a difference a month makes. President Trump’s tariff maneuvers sent financial markets on a rollercoaster. The shock from his aggressive trade policies triggered a surge in volatility, briefly pushing the VIX above 50 – an extremely rare event. In early April, this uncertainty drove risk assets sharply lower, with the S&P 500 falling 19% from its February peak—just shy of the 20% threshold that defines a bear market. But markets quickly rebounded as Trump paused reciprocal tariffs for 90 days and significantly slashed tariffs on Chinese goods. These moves reignited investor confidence, lifting the S&P 500 into positive territory – up +1.1% YTD and above our year-end target of 5,800. This turnaround raises a key question: Where do we go from here? Below, we outline four reasons why we are not changing our views and believe that caution is warranted in the months ahead.
- Too Early To Sound The All-Clear | Despite encouraging signs from this week’s, e-escalation between the US and China it is too soon to declare victory. The temporary pauses (e.g., with reciprocal tariffs and with China) have eased fears of a worst-case economic scenario, but downside risks remain. Our baseline forecast puts the average effective tariff rate in the 15–17% range—its highest level in nearly a century. While economic momentum has remained steady, as reflected by solid private domestic final purchases (+3% QoQ), we expect conditions to cool as the year progresses. Unresolved policy uncertainty and elevated tariffs are likely to slow job growth (though it should remain positive) and soften consumer spending. Our economist expects the US to narrowly avoid recession, but with tariffs projected to end the year nearly 5x higher than where they began, growth is set to slow. Although markets have welcomed the White House’s tariff reversals, it has not altered our view that GDP growth will be ~1% in 2025—the weakest since the COVID downturn in 2020.
- Valuations Are Still Stretched | Following the 19% rally off the April 8 lows, equity valuations now appear stretched by historical standards. The S&P 500’s trailing 12-month P/E ratio stands near 24x—placing it in the 91st percentile over the last 20 years. Meanwhile, the PEG ratio, which factors in expected earnings growth, is even more elevated, sitting in the 99th percentile. From these levels, we see limited room for further multiple expansion—and possibly some contraction—due to several factors. First, as discussed earlier, overall economic growth is slowing. Second, inflation risks may be re-emerging, highlighted by Walmart’s recent warning about upcoming price increases. Third, the 10-year Treasury yield has marched back towards 4.5%, a level that has historically pressured equity valuations. Lastly, market expectations have shifted to just two Fed rate cuts this year. Given these headwinds, earnings will need to take the lead in driving equity gains from here. That would be in line with historical patterns, as valuation multiples typically compress during the third year of a bull market.
- Headwinds For Earnings Remain | At the onset of the trade war, we used a 15% tariff rate as a baseline—anticipating that the initial aggressive tariffs would eventually be negotiated lower. Based on this, we proactively reduced our 2025 S&P 500 earnings estimate from$270 to around $250–255. The reason for this adjustment was twofold: reduced economic activity weighs on sales growth, and rising tariff costs compress margins. While 1Q25 earnings were solid (S&P 500 EPS: +14% YoY), most results only covered the period through March 31— before “Liberation Day” on April 2—so they largely reflect pre-tariff conditions. More telling are the forward-looking revisions: since the start of Q2, consensus estimates for the rest of the year have been revised down by ~4%. Although the China trade truce is a positive step, it hasn’t meaningfully changed our outlook. The average effective tariff rate is only drifting modestly lower toward our assumed 15%, a level not seen since the early 20th century. With persistent economic headwinds, we remain confident in our $250–255 EPS forecast. The current consensus of $264 is still about 4% above our estimate, suggesting further consensus downward revisions are likely.
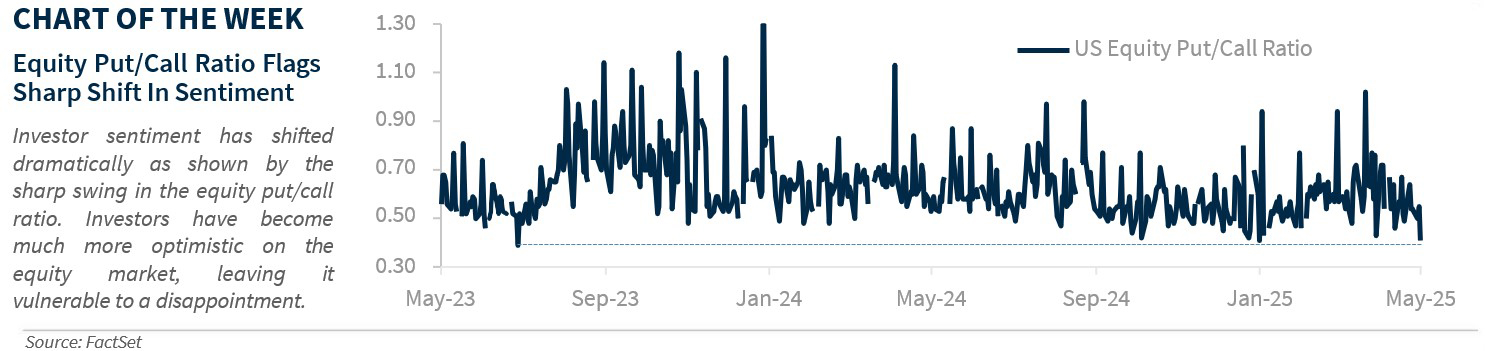
- Technical Backdrop Has Become Less Favorable | The technical backdrop has flipped dramatically following one of the most volatile months in recent memory. After sentiment collapsed in the wake of the tariff rollout, the S&P 500’s swift recovery has seen momentum indicators, such as the 14-day Relative Strength Index shift from deeply oversold conditions (14-day RSI<20) back near overbought territory (14-day RSI>70). After the put/call ratio soared to elevated levels just after “Liberation Day”, it has now fallen to a 1.5-year low—signaling a sharp shift in investor sentiment away from bearishness. The equity market is also now entering a seasonally weaker stretch, as the S&P 500 historically tends to drift sideways during the summer months. With technical indicators no longer offering a bullish tailwind, we expect equities to trade in a choppy, range-bound fashion in the near term. Simply put, the easy money has likely already been made.
The Bottom Line | Following one of the strongest 25-day rallies on record, caution is warranted. Tariff-related headwinds for both the economy and corporate earnings are still unfolding, valuations remain elevated, and technical indicators have turned less supportive. With investor sentiment becoming increasingly optimistic, the market appears more vulnerable to any negative surprises on the earnings or macroeconomic front. Our year-end target of 5,800 implies limited upside, making sector differentiation a key driver of outperformance.
All expressions of opinion reflect the judgment of the author(s) and the Investment Strategy Committee, and are subject to change. This information should not be construed as a recommendation. The foregoing content is subject to change at any time without notice. Content provided herein is for informational purposes only. There is no guarantee that these statements, opinions or forecasts provided herein will prove to be correct. Past performance is not a guarantee of future results. Indices and peer groups are not available for direct investment. Any investor who attempts to mimic the performance of an index or peer group would incur fees and expenses that would reduce returns. No investment strategy can guarantee success. Economic and market conditions are subject to change. Investing involves risks including the possible loss of capital.
The information has been obtained from sources considered to be reliable, but we do not guarantee that the foregoing material is accurate or complete. Diversification and asset allocation do not ensure a profit or protect against a loss.
