

Economic Monitor – Weekly Commentary
by Eugenio Alemán
Better tariff news, but uncertainty to limit potential benefits near term
May 16, 2025
Chief Economist Eugenio J. Alemán discusses current economic conditions.
We know that many shops are changing their view on economic activity due to the partial about-face regarding US-China tariffs, going from 145% to “just” 30%, but a 90-day window does not give comfort to either consumers or businesses. Our current forecast includes a recovery in economic activity during the second quarter of the year on account of a still relatively strong domestic economy and a reduced negative effect from net exports compared to what we saw during the first quarter of the year. However, with the new decision to lower tariffs rates from 145% to 30% for 90 days on imports from China, firms are still in a bind. Would they want to continue to increase purchases from outside (imports) to continue to build inventories and lower the average cost of imports during the second quarter or would they want to wait for a while longer to see if the tariffs are brought down further during the next 90 days?
This question doesn’t have an easy answer and will probably depend on the type of industry/sector. Thus, the economic forecast will depend on the final decision. For that, we will have to wait until May’s trade data is released on July 3rd to see how firms responded to the decision to lower tariffs on China to 30%. Thus, for now, we are not changing our economic growth forecast and will wait for more certainty on the path forward.
Disinflation remained intact in April while consumers were discerning
Despite a stronger than expected increase in shelter prices in April, up 0.3% compared to a 0.2% increase in March, price pressures across the US economy continued to abate, with the year-over-year Consumer Price Index (CPI) slowing down further to 2.3% in April, compared to a rate of 2.4% for the year ending in March. Shelter prices remained almost unchanged on a year-over-year basis at 4.0%. According to the CPI report, the increase in shelter prices during the month of April represented more than 50% of the increase in the headline CPI. At the same time, although the price of energy commodities, i.e., gasoline prices and fuel oil prices, declined during the month, higher natural gas and electricity prices pushed overall energy prices higher by 0.7%.
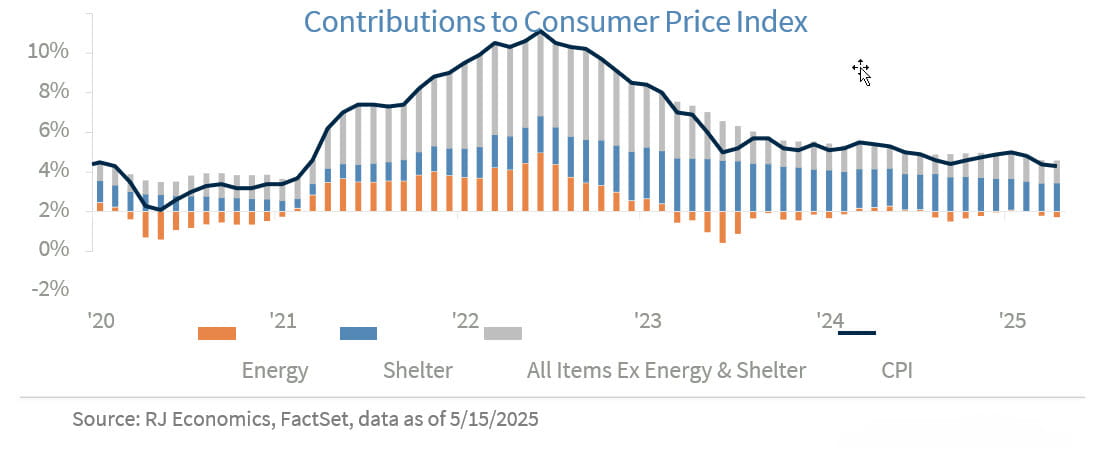
Food prices were also weak in April, as food at home prices declined by 0.4%. But some of the weakness in April was due to a very strong food at home prices print in March of this year, which is probably related to seasonal/calendar patterns as Americans probably increased food at home purchases in March to prepare for Easter in April. At the same time, there was a large decline in eggs prices, down 12.7% month-on- month, which helped bring food prices down further during the month of April.
Food away from home prices increased by 0.4%, month-on-month, consistent with Thursday’s retail and food services report, which showed a strong, back-to-back, increase in sales at food services & drinking places stores, i.e., restaurants, in March and April. Sales at these stores increased by 1.2%, month-on- month in April, after surging by 3.0% in March. Sales at food services & drinking places stores were up 7.8% on a year earlier basis in April.
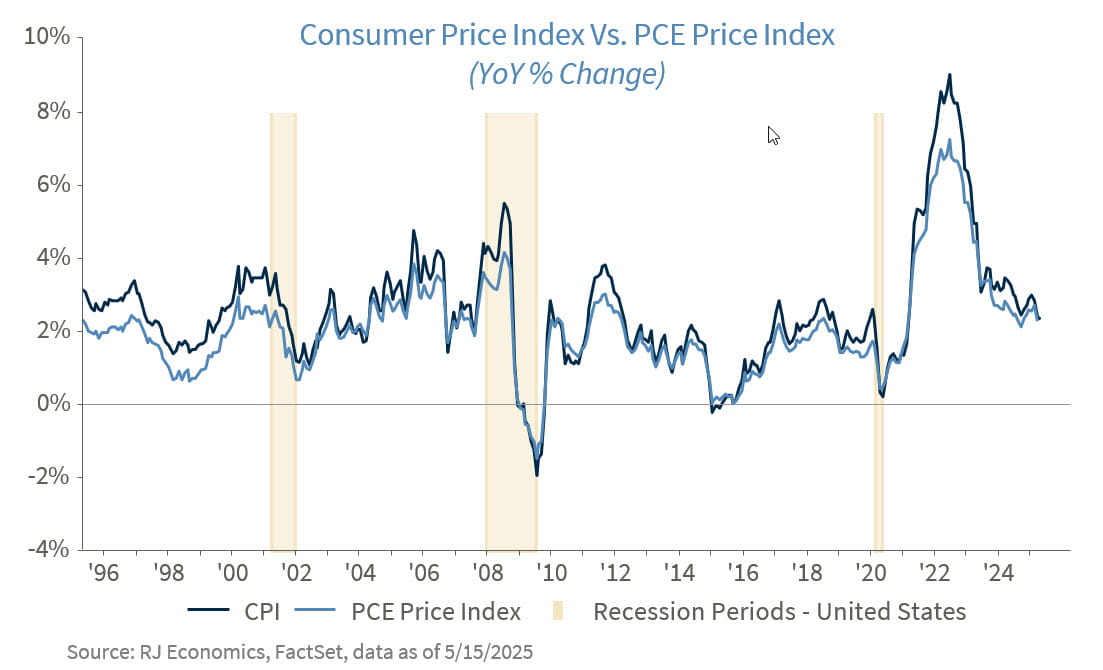
CPI inflation came very close to the 2.0% target in April, at 2.3%, even though the target is for the PCE price index and not the CPI price index. However, we expect the PCE price index to slow down further, to 2.2% on a year-over-year basis in April. This will be the last disinflationary month for several months as we expect base effects as well as price increases from tariffs to start showing up in inflation numbers starting in June.
Although the month-on-month picture for total retail and food services sales were not that strong in April, it came after a very strong month in March. At the same time, every sector of retail and food services sales were up strongly compared to the previous year, except sales at gasoline stations, which were down 6.8% on a year-over-year basis just because gasoline prices were down by 12.2% during the same period. The other exception was the department stores subsector, which declined by 1.4% on a month-on-month basis and was down by 3.4% compared to April of last year.
The fact that so many sectors of retail showed positive prints in April after such a strong performance in March shows that consumers remained engaged in the economy during the month of April, probably still front-loading any future tariff impact. This was especially the case with building materials and garden equipment and supplies dealers' sales, which increased by a strong 0.8% after surging by 2.9% on a month-over-month basis in March. However, we also saw a highly discerning consumer, still going out to eat at restaurants while taking advantage of much lower gasoline prices compared to last year.
In summary, the inflation and retail sales news this month were positive but the prospects for improvement going forward on both sides remain in doubt due to still-high levels of uncertainty regarding the future of tariffs and the impact on prices as well as economic activity.
Economic and market conditions are subject to change.
Opinions are those of Investment Strategy and not necessarily those Raymond James and are subject to change without notice the information has been obtained from sources considered to be reliable, but we do not guarantee that the foregoing material is accurate or complete. There is no assurance any of the trends mentioned will continue or forecasts will occur last performance may not be indicative of future results.
Consumer Price Index is a measure of inflation compiled by the U.S. Bureau of Labor Studies. Currencies investing are generally considered speculative because of the significant potential for investment loss. Their markets are likely to be volatile and there may be sharp price fluctuations even during periods when prices overall are rising.
The National Federation of Independent Business (NFIB) Small Business Optimism Index is a composite of ten seasonally adjusted components. It provides a indication of the health of small businesses in the U.S., which account of roughly 50% of the nation's private workforce.
The producer price index is a price index that measures the average changes in prices received by domestic producers for their output. Its importance is being undermined by the steady decline in manufactured goods as a share of spending.
Links are being provided for information purposes only. Raymond James is not affiliated with and does not endorse, authorize or sponsor any of the listed websites or their respective sponsors. Raymond James is not responsible for the content of any website or the collection or use of information regarding any website's users and/or members.