As of December 7th 2018, only 15 trading days are left for US equities this year. With the recent increase in volatility in the U.S. stock markets, I have had many conversations about 2018 being one of the most volatile years on records. While I wish I knew the answer when fielding statements like this, I usually have to turn to other experts in the market to get those answers. Fortunately, NASDAQ Dorsey Wright has had a timely write up comparing the number of 1, 2, & 3+% days in the S&P 500. I have included their write up on this topic below and I hope it helps you put in perspective where 2018 compares to history.
Unless you’ve been hiding under a rock for the last couple of months, you’re already well aware that there has been a notable pickup in market volatility recently. The increased volatility feels even more pronounced following 2017, which was one of the least-volatile markets in history. Butis the volatility we’ve experienced in 2018 outside of historical norms? Taking a look at historical numbers, we quickly see that the answer is definitely not.
As we discussed in Tuesday’s “Were you Aware? ” thus far in 2018 (through 12/5), there have been 56 days in which the S&P 500 (SPX) moved at least +/- 1%, which is seven times the amount of such moves we saw during the tranquil times of 2017. However, we need only look back to 2015to find a year in which we had more +/- 1% days – in that year the market recorded 72 such days. With only 17 trading days remaining in the year (including 12/6), SPX would have to move at least 1% every day until the end of the year to exceed that mark.
However, just looking at the number of days in which the market moved more than 1%, doesn’t necessarily give us a complete picture of overall volatility – just this week we had a day (12/4) when the S&P 500 was down 3.24%. So, could we have a market that is having an abnormally high number of larger moves? Not really. Thus far in 2018, there have been 15 days when the market changed at least +/- 2% and five days when it moved at least 3%. And while each of these moves outpace the mark set in 2015 (10 2% days and three 3% days), we still need only go back to 2011 to find a year that exceeded these numbers. In 2011, the S&P 500 had 96 +/- 1% days, 35 +/- 2% days, and 12 +/- 3% days. Meanwhile, each of the three years preceding 2011 also recorded more 1%, 2%, and 3% days, than we have seen thus far in 2018.
Since 1928, on average SPX has moved more than 1% on 60.26 days each year, more than 2% on 16.76 days each year, and more than 3% on 6.58 days each year. So, while the recent volatility has been painful, from a historical perspective, the volatility in 2018 has been in-line with historical averages.
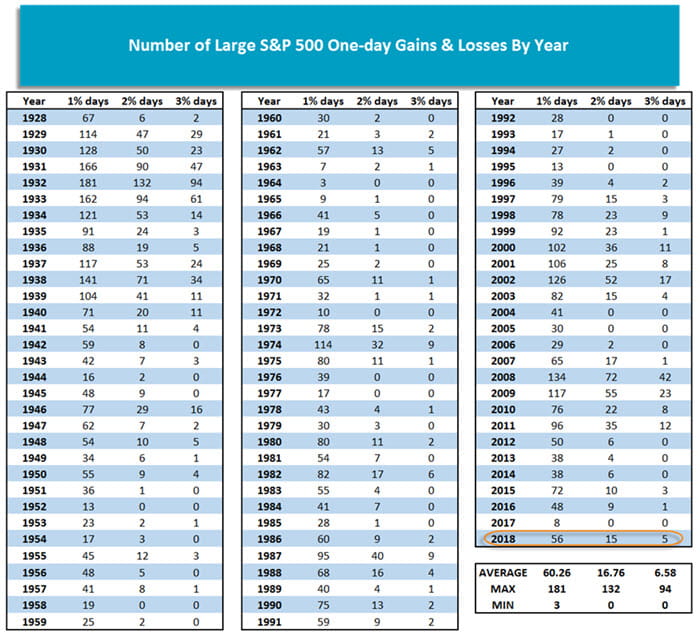
Source: NASDAQ Dorsey Wright
DORSEY WRIGHT: BPI is an indicator used to identify changes in trend for the period being evaluated. Generally, if the reading is above 70%, it is considered overbought. If the reading is below 30%, it is considered oversold. Reversals in BPI indicate changes in market trend. The calculation of percent is defined as each component of the index/exchange's buy signal added together. This number is divided by the total number of stocks in the index/exchange. If there are no stocks with a buy signal, the % is 0. X's define an upward trend. O's define a downward trend. Numbers within the chart define the beginning of the month. Example: 1 = January, 2 = February, etc. One cannot invest directly in an index. Past Performance does not guarantee future results. Analysis and material prepared by Dorsey Wright & Associates (DWA), an independent third party.
The S&P 500 is an unmanaged index of 500 widely held stocks that is generally considered representative of the U.S. stock market.
The information contained in this report does not purport to be a complete description of the securities, markets, or developments referred to in this material. The information has been obtained from sources considered to be reliable, but we do not guarantee that the foregoing material is accurate or complete. Any opinions are those of the author and not necessarily those of Raymond James. Expressions of opinion are as of this date and are subject to change without notice. There is no guarantee that these statements, opinions or forecasts provided herein will prove to be correct. Investing involves risk and you may incur a profit or loss regardless of strategy selected. Keep in mind that individuals cannot invest directly in any index, and index performance does not include transaction costs or other fees, which will affect actual investment performance. Individual investor's results will vary. Past performance does not guarantee future results. Future investment performance cannot be guaranteed, investment yields will fluctuate with market conditions.
