
Federal Reserve 75 basis points cuts expectation in 2024 lacked conviction
- 03.22.24
- Economy & Policy
- Commentary
Chief Economist Eugenio J. Alemán discusses current economic conditions.
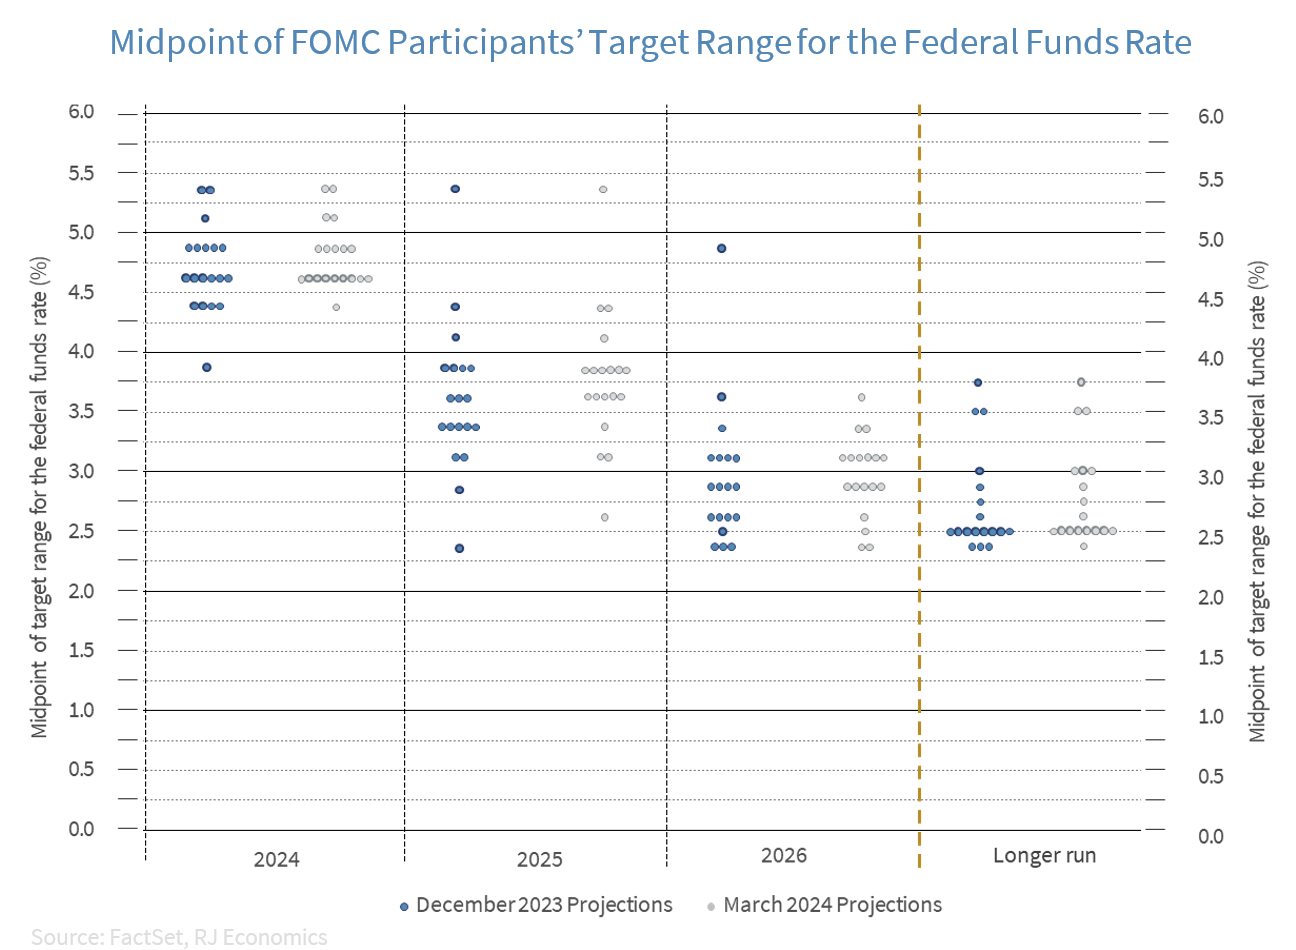
Markets have taken the Federal Reserve (Fed) decision to keep about 75 basis points (bps) cuts in its dot plot as a very positive sign that the Fed is going to actually cut 75 bps during the year and are still acting upon the news. However, we believe the dot plot was in flux during this Federal Open Market Committee (FOMC) meeting, and we think this ‘flux’ was more a reflection of the Fed’s lack of conviction regarding inflation, which could threaten the 75 basis points of expected cuts by year-end 2024. This lack of conviction was further reflected in the 2025 dot plot rate cut expectations, which went from 100 bps in December of last year to just 75 bps in the dot plot just released.
It is clear, and the Fed Chairman has been pounding the airways continuously over the last several months, that Fed officials are lacking conviction that the disinflationary process is here to stay. This lack of conviction regarding the disinflationary path has filtered into their lack of conviction on how much interest rates are going to move down this year. For now, they kept 75 bps as their base case but expect changes coming to the dot plot in June if they don’t gain more conviction on the future path of inflation during the next several months.
Although we do not believe that, today, there is a possibility for rates to go up from here, the path downward for interest rates is not as clear as it was in 2023, because the economy has continued to surprise on the upside.
Forecast changes: We no longer have a mild recession
This weekly report includes changes to our economic forecast that are a bit more consequential than what we have had in the past. The major change to our forecast is that we are dropping our “very mild recession” call and moving to a “soft landing” scenario. Although we still believe the U.S. economy will continue to slow during the next several quarters, we no longer believe that the slowdown is going to be enough to bring economic growth to negative territory for two consecutive quarters, which is, correctly or not, what some argue defines an economic recession.
Our change in forecast is related to the fact that real fixed private domestic investment has remained extremely strong considering how high interest rates are today. Our original very mild recession call was predicated on the fact that real residential investment was going to drop, and this was going to take real non-residential investment down, following a deterioration of ‘animal spirits’ whereby negative expectations about the future would push companies to start cutting jobs as well as production. However, although residential investment tanked as soon as the Fed started rising interest rates and continued to fall for nine consecutive quarters, the lack of supply of homes, especially in the existing homes market has, once again, pushed real residential construction up starting in the third quarter of last year. Furthermore, recent strength in new homes construction as well as new home sales is going to continue to keep real residential investment above ground.
The graph below shows the behavior of real residential and non-residential investment over the year on a four-quarter average rate of change and it points out that the current cycle is more similar to the mid-1990’s cycle than to any other cycle in which the economy went into recession. This was a time when the U.S. economy was able to avoid a recession amid increasing interest rates because non-residential investment continued to improve even as the Fed increased interest rates.
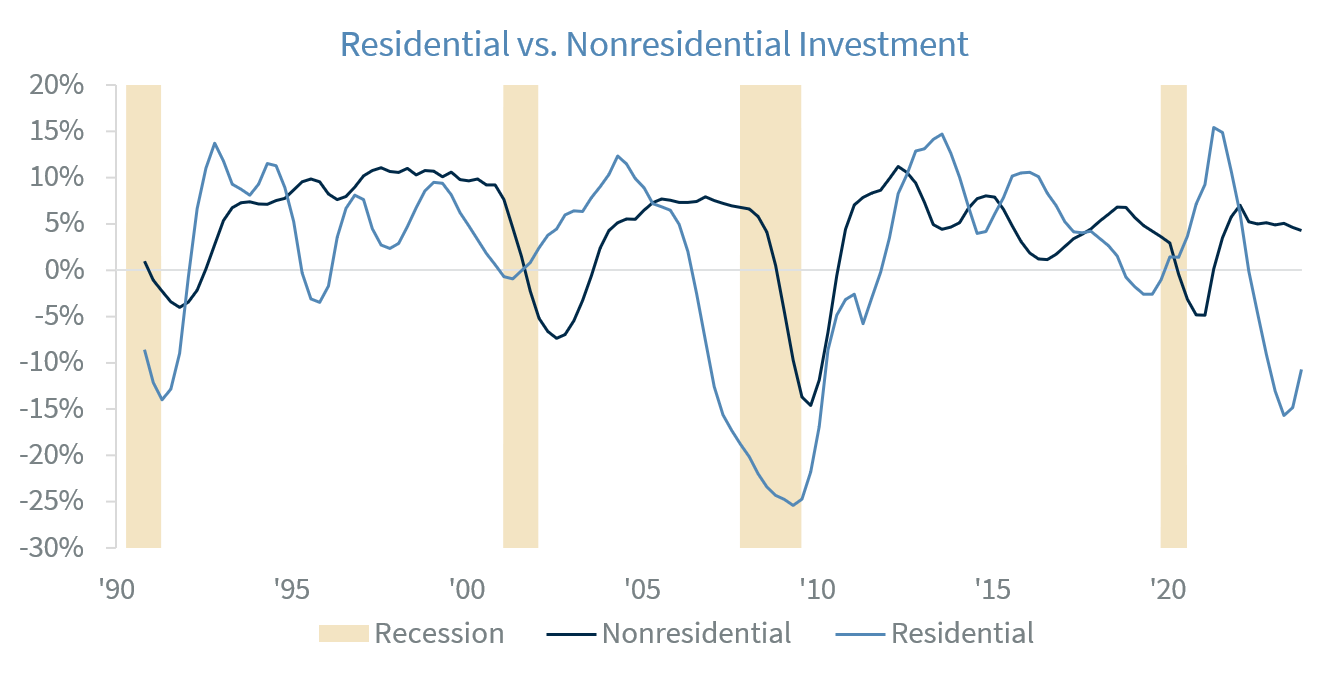
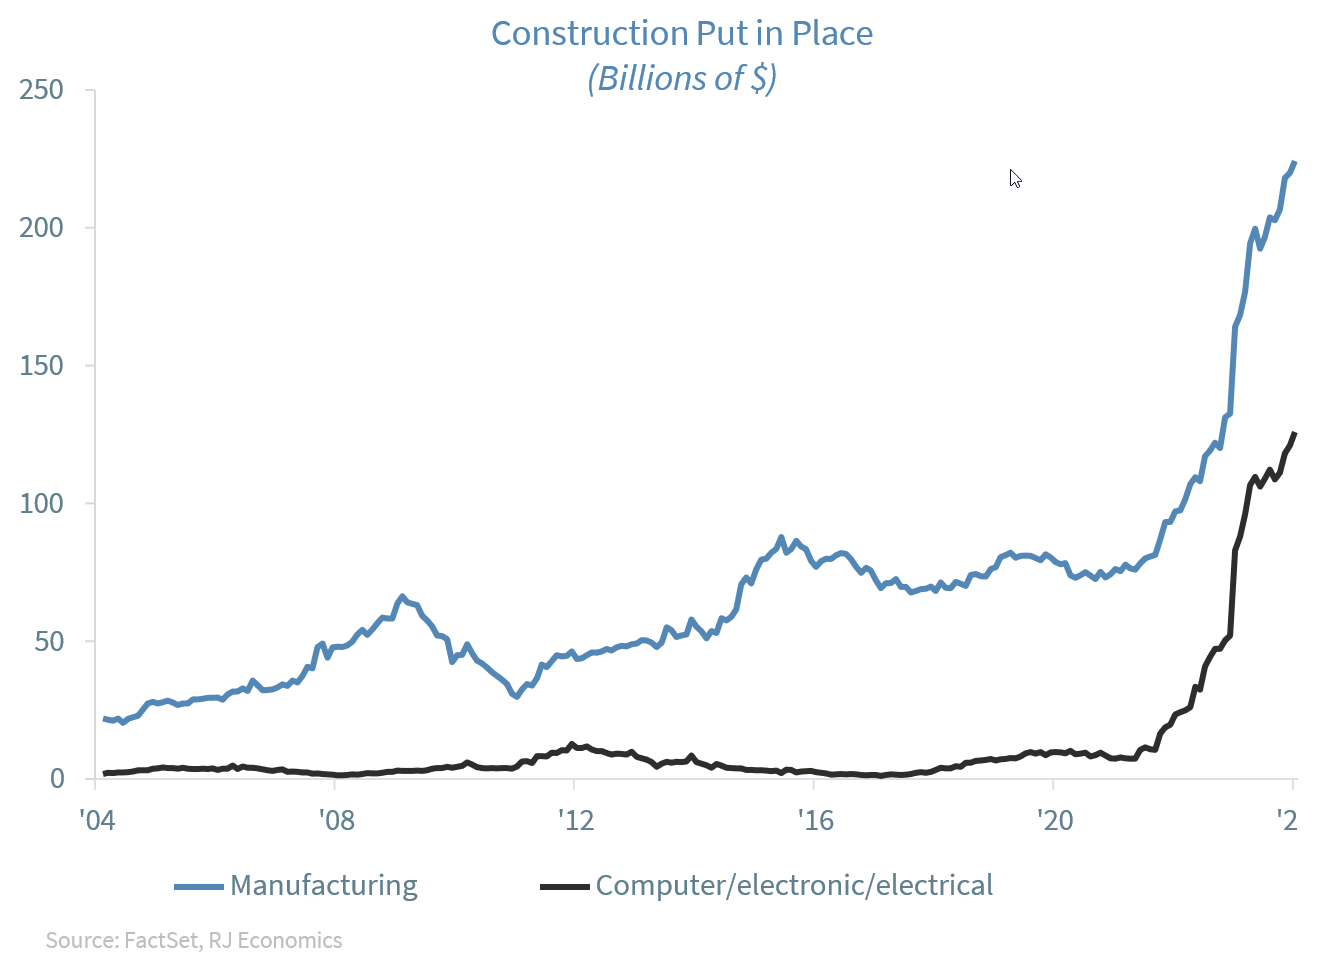
At the same time, real non-residential investment has remained above ground during the whole period as higher interest rates have been more than neutralized by the effects of the CHIPS act as well as the IRA, which have produced an impressive increase in the construction of manufacturing plants in the U.S..
Still, higher interest rates are going to continue to weigh on the strength of the U.S. consumer and cut into real personal consumption expenditures as some consumer sectors deal with heavy credit card burdens. However, we still believe that as long as the U.S. consumer has the ability to keep its jobs and remains positive about its ability to keep their jobs, the slowdown in consumption will be measured and not abrupt. Thus, we are expecting consumer demand to slow rather than collapse, barring any severe shock hitting the U.S. economy.
We are also changing our forecast for the federal funds rate for this year and only have three rate cuts rather than three to four as we had until now. However, as we said in the first section of this weekly, we will have to wait until the June dot plot to see if Fed official continue to “lack conviction” regarding the future path of inflation and thus, the path of interest rates.
Economic and market conditions are subject to change.
Opinions are those of Investment Strategy and not necessarily those of Raymond James and are subject to change without notice. The information has been obtained from sources considered to be reliable, but we do not guarantee that the foregoing material is accurate or complete. There is no assurance any of the trends mentioned will continue or forecasts will occur. Last performance may not be indicative of future results.
Consumer Price Index is a measure of inflation compiled by the US Bureau of Labor Statistics. Currencies investing is generally considered speculative because of the significant potential for investment loss. Their markets are likely to be volatile and there may be sharp price fluctuations even during periods when prices overall are rising.
Consumer Sentiment is a consumer confidence index published monthly by the University of Michigan. The index is normalized to have a value of 100 in the first quarter of 1966. Each month at least 500 telephone interviews are conducted of a contiguous United States sample.
Personal Consumption Expenditures Price Index (PCE): The PCE is a measure of the prices that people living in the United States, or those buying on their behalf, pay for goods and services. The change in the PCE price index is known for capturing inflation (or deflation) across a wide range of consumer expenses and reflecting changes in consumer behavior.
The Consumer Confidence Index (CCI) is a survey, administered by The Conference Board, that measures how optimistic or pessimistic consumers are regarding their expected financial situation. A value above 100 signals a boost in the consumers’ confidence towards the future economic situation, as a consequence of which they are less prone to save, and more inclined to consume. The opposite applies to values under 100.
Certified Financial Planner Board of Standards Inc. owns the certification marks CFP®, CERTIFIED FINANCIAL PLANNER™, CFP® (with plaque design) and CFP® (with flame design) in the U.S., which it awards to individuals who successfully complete CFP Board's initial and ongoing certification requirements.
Links are being provided for information purposes only. Raymond James is not affiliated with and does not endorse, authorize or sponsor any of the listed websites or their respective sponsors. Raymond James is not responsible for the content of any website or the collection or use of information regarding any website's users and/or members.
GDP Price Index: A measure of inflation in the prices of goods and services produced in the United States. The gross domestic product price index includes the prices of U.S. goods and services exported to other countries. The prices that Americans pay for imports aren't part of this index.
The Conference Board Leading Economic Index: Intended to forecast future economic activity, it is calculated from the values of ten key variables.
The Conference Board Coincident Economic Index: An index published by the Conference Board that provides a broad-based measurement of current economic conditions.
The Conference Board lagging Economic Index: an index published monthly by the Conference Board, used to confirm and assess the direction of the economy's movements over recent months.
The U.S. Dollar Index is an index of the value of the United States dollar relative to a basket of foreign currencies, often referred to as a basket of U.S. trade partners' currencies. The Index goes up when the U.S. dollar gains "strength" when compared to other currencies.
The FHFA House Price Index (FHFA HPI®) is a comprehensive collection of public, freely available house price indexes that measure changes in single-family home values based on data from all 50 states and over 400 American cities that extend back to the mid-1970s.
Import Price Index: The import price index measure price changes in goods or services purchased from abroad by U.S. residents (imports) and sold to foreign buyers (exports). The indexes are updated once a month by the Bureau of Labor Statistics (BLS) International Price Program (IPP).
ISM New Orders Index: ISM New Order Index shows the number of new orders from customers of manufacturing firms reported by survey respondents compared to the previous month. ISM Employment Index: The ISM Manufacturing Employment Index is a component of the Manufacturing Purchasing Managers Index and reflects employment changes from industrial companies.
ISM Inventories Index: The ISM manufacturing index is a composite index that gives equal weighting to new orders, production, employment, supplier deliveries, and inventories.
ISM Production Index: The ISM manufacturing index or PMI measures the change in production levels across the U.S. economy from month to month.
ISM Services PMI Index: The Institute of Supply Management (ISM) Non-Manufacturing Purchasing Managers' Index (PMI) (also known as the ISM Services PMI) report on Business, a composite index is calculated as an indicator of the overall economic condition for the non-manufacturing sector.
Consumer Price Index (CPI) A consumer price index is a price index, the price of a weighted average market basket of consumer goods and services purchased by households. Changes in measured CPI track changes in prices over time.
Producer Price Index: A producer price index (PPI) is a price index that measures the average changes in prices received by domestic producers for their output.
Industrial production: Industrial production is a measure of output of the industrial sector of the economy. The industrial sector includes manufacturing, mining, and utilities. Although these sectors contribute only a small portion of gross domestic product, they are highly sensitive to interest rates and consumer demand.
The NAHB/Wells Fargo Housing Opportunity Index (HOI) for a given area is defined as the share of homes sold in that area that would have been affordable to a family earning the local median income, based on standard mortgage underwriting criteria.
The S&P CoreLogic Case-Shiller U.S. National Home Price NSA Index measures the change in the value of the U.S. residential housing market by tracking the purchase prices of single-family homes.
The S&P CoreLogic Case-Shiller 20-City Composite Home Price NSA Index seeks to measures the value of residential real estate in 20 major U.S. metropolitan.
Source: FactSet, data as of 7/7/2023
