
The Week in Review 7/3/2023
"Often we look so long at the closed door that we do not see the one which has been opened for us." - Helen Keller
Good Morning,
The Bull marches on!
All 11 S&P 500 sectors finished higher last week… the major indices all finished higher; and value stocks as a class finished higher which has been rare… so did the growth stocks.
At this juncture, it will surprise no one to hear that the mega-cap stocks as a class also finished higher. For the week, we saw Mega-caps up 2.0%. More importantly, though, we saw the equally weighted S&P 500 gaining 3.4% this week in a show of broad-based buying interest.
It was a fitting end to a month that saw the market-cap weighted S&P 500 break out above 4,200... then 4,300... and then 4,400 before settling the quarter at 4,450. The Nasdaq Composite for its part recorded its best first half (+31.7%) since 1983!
Plenty to think about last week…
- A reported coup attempt in Russia (which ended almost as quickly as it began).
- A batch of encouraging economic data (May Durable Goods Orders, June Consumer Confidence, May New Home Sales, Weekly Initial Jobless Claims, the upward revision to Q1 GDP, and the May Personal Income and Spending).
- Reminders from Fed Chair Powell, ECB President Lagarde, and BoE Governor Bailey that more tightening will likely be needed to bring down inflation.
- A series of IPOs… it has been a while!
- The release of the Federal Reserve's annual bank stress test results, in which all 23 banks taking the test passed.
- And there also were earnings results -- some good and some bad -- from the likes of Carnival Corp., Walgreens Boots Alliance, General Mills, Micron, and Nike.
Investors clung to belief that the U.S. economy can avoid a recession and that the Federal Reserve is close to being done raising rates. Which led to the broad-based buying interest.
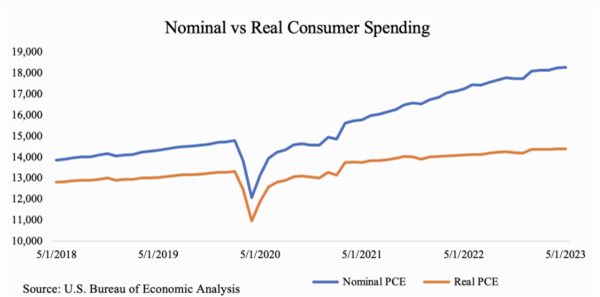
Another driver of optimism is Consumer Spending, which remains brisk…
Notably, the sectors that were relative laggards this week were the countercyclical consumer staples (+0.6%), health care (+0.6%), and utilities (+0.7%) sectors. To be fair, communication services (+0.4%) was the least strong of all, having been pressured by a 1.7% decline in Alphabet, which was downgraded at UBS on Monday and at Bernstein on Tuesday.
Real estate (+5.0%) and energy (+4.8%) were the best-performing sectors this week followed by materials (+4.0%), industrials (+3.9%), financials (+2.9%), information technology (+2.9%), and consumer discretionary (+2.5%).
|
Index |
Started Week |
Ended Week |
Change |
% Change |
YTD % |
|
DJIA |
33727 |
34407.6 |
680.2 |
2 |
3.8 |
|
Nasdaq |
13493 |
13787.9 |
295.42 |
2.2 |
31.7 |
|
S&P 500 |
4348.3 |
4450.38 |
102.05 |
2.3 |
15.9 |
|
Russell 2000 |
1821.6 |
1888.73 |
67.1 |
3.7 |
7.2 |
The Treasury market had a different experience though, digesting another round of new supply and the bullish behavior of the stock market that might have spurred some asset reallocation trades. The 2-yr note yield increased 13 basis points this week to 4.88% while the 10-yr note yield rose eight basis points to 3.82%.
Market Snapshot…
- Oil Prices – Oil prices settled higher but posted a fourth straight quarterly decline. U.S. West Texas Intermediate (WTI) crude futures settled up 78 cents, or 1.1% at $70.64 a barrel. Brent crude settled up 56 cents, or 0.8%, at $74.90.
- Gold– Gold was headed for its first quarterly decline in three. Spot gold was up 0.5% to $1,917.94 per ounce, while U.S. gold futures settled 0.6% higher at $1,929.40. Silver finished the week at $23.02.
- U.S. Dollar– The U.S. dollar index was lower on Friday after two straight days of gains. The dollar index fell 0.377% at 102.92. Euro/US$ exchange rate is now 1.092.
- U.S. Treasury Rates– Treasury yields changed little as investors assessed the latest inflation data and its implications for the Fed’s next interest rate move. The 10-year Treasury was down by 1 basis point at 3.841%.
- Asian shares were up in overnight trading.
- European markets are trading in the green.
- Domestic markets mostly higher this morning.
We begin the second half of 2023… we seem to be seeing a change in the wind, from a Bear Market that saw losses of 27%+ from peak to trough to a market that continues to show strength.
What is truly interesting to us is few individual investors are that optimistic… but that is usually the case.
Friday’s jobs report will be the first major economic release of the month and quarter, and could shape the narrative of the Fed’s policy decision later this month.As a reminder, the stock market will be closing early today at 1:00 p.m. EST in observance of Independence Day. Markets will be closed on Tuesday, July 4.
We are so very blessed to live in the US, in spite of all the challenges… we hope your Independence Day is safe, happy, and full of family!!
The opinions expressed herein are those of Michael Hilger and not necessarily those of Raymond James & Associates, Inc., and are subject to change without notice. The information contained in this report does not purport to be a complete description of the securities, markets, or developments referred to in this material. There is no assurance any of the trends mentioned will continue or forecasts will occur. The information has been obtained from sources considered to be reliable, but Raymond James does not guarantee that the foregoing material is accurate or complete. Investing involves risk and you may incur a profit or loss regardless of strategy selected.
The information contained herein is general in nature and does not constitute legal or tax advice. Inclusion of these indexes is for illustrative purposes only. Keep in mind that individuals cannot invest directly in any index, and index performance does not include transaction costs or other fees, which will affect actual investment performance. Individual investor's results will vary. Past performance does not guarantee future results. The Dow Jones Industrial Average (INDU) is the most widely used indicator of the overall condition of the stock market, a price-weighted average of 30 actively traded blue chip stocks, primarily industrials. The Dow Jones Transportation Average (DJTA, also called the "Dow Jones Transports") is a U.S. stock market index from the Dow Jones Indices of the transportation sector, and is the most widely recognized gauge of the American transportation sector. Standard & Poor's 500 (SPX) is a basket of 500 stocks that are considered to be widely held. The S&P 500 index is weighted by market value, and its performance is thought to be representative of the stock market as a whole. The NASDAQ Composite Index (COMP.Q) is an index that indicates price movements of securities in the over-the-counter market. It includes all domestic common stocks in the NASDAQ System (approximately 5,000 stocks) and is weighted according to the market value of each listed issue. The Russell 2000 index is an unmanaged index of small cap securities which generally involve greater risks.
Dividends are not guaranteed and must be authorized by the company's board of directors.
Diversification does not ensure a profit or guarantee against a loss.
Investing in oil involves special risks, including the potential adverse effects of state and federal regulation and may not be suitable for all investors.
International investing involves special risks, including currency fluctuations, differing financial accounting standards, and possible political and economic volatility.
The companies engaged in the communications and technology industries are subject to fierce competition and their products and services may be subject to rapid obsolescence.
Gold is subject to the special risks associated with investing in precious metals, including but not limited to: price may be subject to wide fluctuation; the market is relatively limited; the sources are concentrated in countries that have the potential for instability; and the market is unregulated.
The information contained within this commercial email has been obtained from sources considered reliable, but we do not guarantee the foregoing material is accurate or complete.
Any information is not a complete summary or statement of all available data necessary for making an investment decision and does not constitute a recommendation. Prior to making an investment decision, please consult with your financial advisor about your individual situation.
Charts are reprinted with permission, further reproduction is strictly prohibited.
