

The Presidential Election Cycle and the Stock Market: A Polarized duo!
This election season has been a particularly vitriolic one between two candidates whom an ABC News/Washington Post poll have found to be the least popular in the history of their polling of more than 30 years.1
Our first presidential debate kicked off on Monday, September 26th just 30 minutes after kickoff of the Monday Night Football game between the Atlanta Falcons and New Orleans Saints. For those who missed this high-scoring battle of stamina, the debate brought viewers such fanfare as name-calling, talking over each other and the moderator, accusations of sexism, racism, tax dodging, email dodging, all with a liberal amount of sniffing.
After the candidates had a chance to lick their wounds, they faced off on the presidential pitch again during another gladiatorial bout- 30 minutes after the start of the Sunday night game between the New York Giants and Green Bay Packers. Perhaps the Commission on Presidential Debates found it prudent to deter viewership of such a violent and exploitative contest, which this time included a glimpse into the locker room as Trump attempted to explain what he referred to as “locker room talk.”
In this contest Trump elected to grab the campaign by the… moment, and firmly secure an opportunity to bring three women, who in the past have accused former president Bill Clinton of inappropriate sexual behavior, in for a live streaming event less than two hours before the start of the debate. Though this debate eventually ended in a handshake, the spectacle included finger-pointing accusations of sexual misconduct of Donald Trump and Bill Clinton, talk of rape, racial and gender-specific pandering, an expansion of the name-calling which escalated to Donald Trump calling Hillary Clinton “the Devil”, and would have been more appropriately moderated by a child daycare worker.
In the midst of this fanfare, I am often asked by clients what the final outcome of such bare-knuckled exchanges might mean for the stock market. There is an abundance of publications available on what is referred to as “Presidential Election Cycle Theory”, and one can easily find online articles published by such reputable sources as CNBC, The Stock Trader’s Almanac, and Forbes on this very topic. The theory combines some quantitative numbers and qualitative likely explanations, and upon a cursory read of some of the available articles and data they reference it may prompt one to be concerned as we approach the election. But could the findings of such articles, and the statistics which they are based upon, be misleading?
Upon referencing the following chart published in the CNBC article Why Markets Tend to Fall During a Presidential Election Year (listed in my references), it is easy to see how one might speculate that the final year of a presidential cycle, where a change in leadership is all but guaranteed as per the 22nd amendment, has been an historically poor year for investors in the US market.
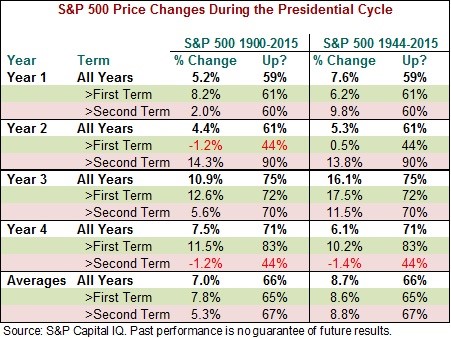
Source: CNBC3
According to this article, since 1900 the S&P 500 has, on average, fallen by 1.2% in year 8, with the market rising only 44% of the time. The author of this article (published during the January 2016 stock market dip) goes on to allege that “if history is any indication, it’s not going to get any better. Why? Because markets tend to fall in the last year of a president’s second term.”(CNBC)3.
Doesn’t look good, right? If that wasn’t bleak enough, let’s take a look at the following chart from an article in Forbes entitled Market Volatility and Presidential Election Years.
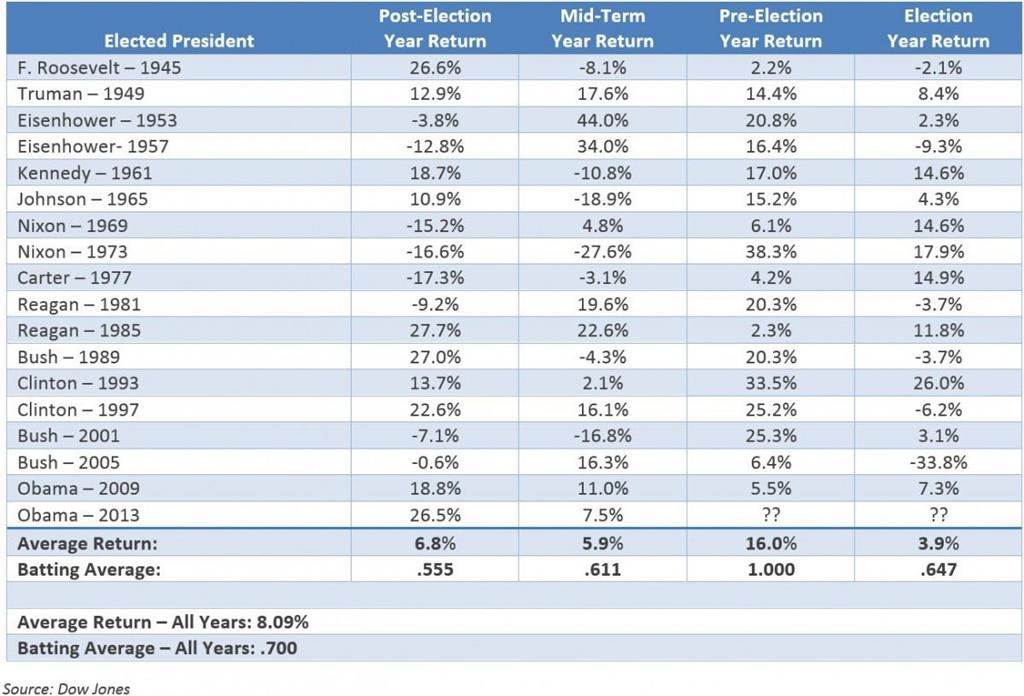
Looking at these data it looks like the Dow Jones Industrial Average has generated a 3.9% price return during the previous 17 election years, as compared to an average return of 8.09% for all years. It also appears that the positive-year “batting average” of .647 is lower than the average of .700. The author of the article claims the data suggests election years have been years in which stock market returns have been lower than normal, though positive nonetheless.
The author goes on to analyze the specific years when the public “knew” they were going to elect a new president after their term. Specifically:
- Eisenhower (53)
- Kennedy (61)
- Nixon (69)
- Bush (89)
- Obama (09)
On average, the above election years showed an average annual return of -5.6 percent, with a “batting average” of only .500. The author claims that as far as history goes, an election year in which the public knows a new president will be elected is among the worst periods of the 4-year presidential cycle analysis. While the authors statements are factually correct, is it statistically relevant?
You can find the link to the article in my reference below, and for the time-crunched here are a few of the points that article tried to drive home (paraphrased from their own bullet points):
- Investors don’t like uncertainty. No one knows 100% who the next president will be and what policies are going to be proposed
- Years where a new president is going to be elected tend to be even worse performing years when the incumbent is running
- Poor performance in the “mid-term” year was explained as the result of two types of political uncertainties- both the mid-term election and the year when a president tends to launch their “signature” programs for their term
- The best performing year tends to be the year with a rather limited level of uncertainty
Though what you have read so far might be making sense (aside from our current debate shenanigans, of course), it is due to the following points and analysis that – spoiler alert - I am declaring “shenanigans” on the presidential market theory and the notion that it could serve as any reliable indicator of the stock market.
- All times are uncertain. You don’t know with 100% certainty that a plane won’t fly through your living room today
- The 2007 housing market collapse and in turn the 2008 stock market crash, caused in large part by decades of government subsidies and protection, skewed the analysis and had nothing to do with the election cycle. Housing represents about half of household net worth and about 2/3rds of GDP in the US4
- Sample size.
- Sample size.
- Sample size.
You may have heard the phrase “Statistics don’t lie, but liars use statistics.” How appropriate it is that this analysis focuses on politicians! Let’s examine one such possible example, the claim that since 1900 the S&P 500 has, on average, fallen by 1.2% in year 8, with the market rising only 44% of the time, and that “markets tend to fall in the last year of a president’s second term.”
I believe this claim to be a quintessential example of a red herring.
First of all, prior to February 27, 1951, this notion of a “final year of a second term”, or “year 8”, meant nothing. Ever hear of a guy by the name of Franklin Delano Roosevelt? His reign was so long and changes enacted so drastic that congress went on to pass the following amendment shortly after his death:
Amendment XXII
Section 1. No person shall be elected to the office of the President more than twice, and no person who has held the office of President, or acted as President, for more than two years of a term to which some other person was elected President shall be elected to the office of the President more than once. But this article shall not apply to any person holding the office of President when this article was proposed by the Congress, and shall not prevent any person who may be holding the office of President, or acting as President, during the term within which this article becomes operative from holding the office of President or acting as President during the remainder of such term.
This amendment was passed by Congress on March 21, 1947, and ratified by 36 of the then-48 states on February 27, 1951.
Thus, the inclusion of any president’s “year 8” which occurred prior to the passage of this amendment is inherently flawed for the purposes of analyzing a theorized historic market reaction to an inevitable change in presidential leadership.
All this noted, let’s take a quick journey through time back to 1900 and examine this claim and a few additional imbedded statistical misgivings, as the Forbes author also specifically mentioned poor historic final presidential year performance which have occurred more recently:
William McKinley, elected in 1896, was on track to have an eighth year in 1904 but was shot on September 6, 1901 and died September 14, 1901. He was succeeded by Theodore Roosevelt, who became the 26th president. Technically his final year of president was his fifth, not his 8th.5
FDR actually served 13 years, from 1932 to 1945. He was on track to have a year 16, but died of a cerebral hemorrhage on April 12, 1945. Given his ability to get re-elected for a third (and fourth for that matter) term, should this really affect the incumbent data? Sidebar- the Social Security program created during his reign currently accounts for 39% of Federal Mandatory Spending & nearly a quarter of total Federal spending.6
Harry S Truman served from 1945-1952, becoming the 33rd President when Roosevelt died of a cerebral hemorrhage on April 12, 1945. Technically his presidency lasted a few months shy of the eight year mark and he was the last president eligible to run for a third term. That said, likely due in large part to the 22nd amendment being ratified during his time as president he chose not to run again and thus the 1952 election year should count as a “year 8” for the purposes of this analysis.
Lyndon B Johnson, or “LBJ”, became president on November 22nd, 1963 when President Kennedy was assassinated. Because he completed less than half of Kennedy's presidency he was eligible to run again for the 1968 election, but similar to Truman, chose not to after a disappointing primary. As his presidency was only barely in excess of five years, his final year was not included in our T-Test of "year 8" candidates.Richard Nixon, elected in 1968 and again in 1972, was on track for an eighth year but resigned on August 9, 1974 following the Watergate scandal. He was succeeded by Gerald Ford, who was appointed by Congress and became the first and to date only person to have served as both Vice President and President of the United States without being elected to either office.

Peace out!
So that leaves us with the following basket in the 1900 claim:
- Woodrow Wilson: 1912-1920
- Franklin D. Roosevelt: 1932-1945* 1940 was year 8
- Harry S. Truman: 1945-1952*
- Dwight Eisenhower: 1952-1960
- Ronald Reagan: 1980-1988
- Bill Clinton: 1992-2000
- George W. Bush: 2000-2008
That’s a sample size of seven. Of that seven, Wilson and FDR are not relevant for the purposes of the analysis due to the lack of term limits, and while Truman didn’t technically have a year eight his final year should be included nonetheless due to his decision not to pursue a third term and corresponding market-known change ahead in presidential leadership. That leaves us with… Five. A sample size of five is not statistically relevant to begin with, but we took it a step further and conducted a T-Test.
For the historic S&P 500 final presidential term election years indicated above, when analyzed subjective to a two-sided T-Test with a confidence level of 99% there is no difference from those years to all others back to 1900.
So there you have it… The Presidential Cycle Theory is at worst nonsense, and at best so many decades in its infancy that our government, if it still exists at the time, will likely (and hopefully!) look dramatically different at the time of its statistical relevance. But to the Chicken Littles of the world, look at the bright side; at the end of the year your sample size will jump 20%! ...To six.
References:
- http://abcnews.go.com/Politics/poll-clinton-unpopularity-high-par-trump/story?id=41752050
- http://www.cnn.com/2016/10/09/politics/donald-trump-juanita-broaddrick-paula-jones-facebook-live-2016-election/
- http://www.cnbc.com/2016/01/13/why-markets-tend-to-fall-during-a-presidential-election-year.html
- https://www.federalreserve.gov/pubs/ifdp/2011/1027/ifdp1027.htm
- http://2008election.procon.org/view.resource.php?resourceID=001565
- https://www.cbo.gov/sites/default/files/114th-congress-2015-2016/graphic/51110-budget1overall.pdf
