

Kicking the can down the road
- 02.05.24
- Markets & Investing
- Commentary
Drew O’Neil and Doug Drabik discusses fixed income market conditions and offers insight for bond investors.
The world had a pandemic – COVID-19. This pandemic unfortunately and unbiasedly took lives, created widespread fear, and rocked the economic world. The U.S. threw a lot of money at this challenge, enacted government backstops to protect businesses and individuals, and intensified spending, all to keep the economy moving in a positive direction. Much of the action was likely necessary and consequences have emerged but is its path of economic impairment behind us or has its impact merely been kicked down the road?
It would be hard to argue that the Federal Reserve and government actions implemented during the COVID pandemic weren’t warranted. Shutting down businesses and interrupting services, which occurred to an extreme extent, carry potential catastrophic consequences. One could argue that these Federal Reserve and Government actions may have averted a longer recession if not a depression.
Now several years from the pandemic’s dawn but still dealing with its aftershocks, what does the economy look like? Is inflation under control? Have we averted a more vigorous recession? How is the Fed likely to interact with the markets? Are interest rates going to change? What about consumer behavior? What fixed income opportunities exist in light of our economic fate?
The U.S. Gross Domestic Product
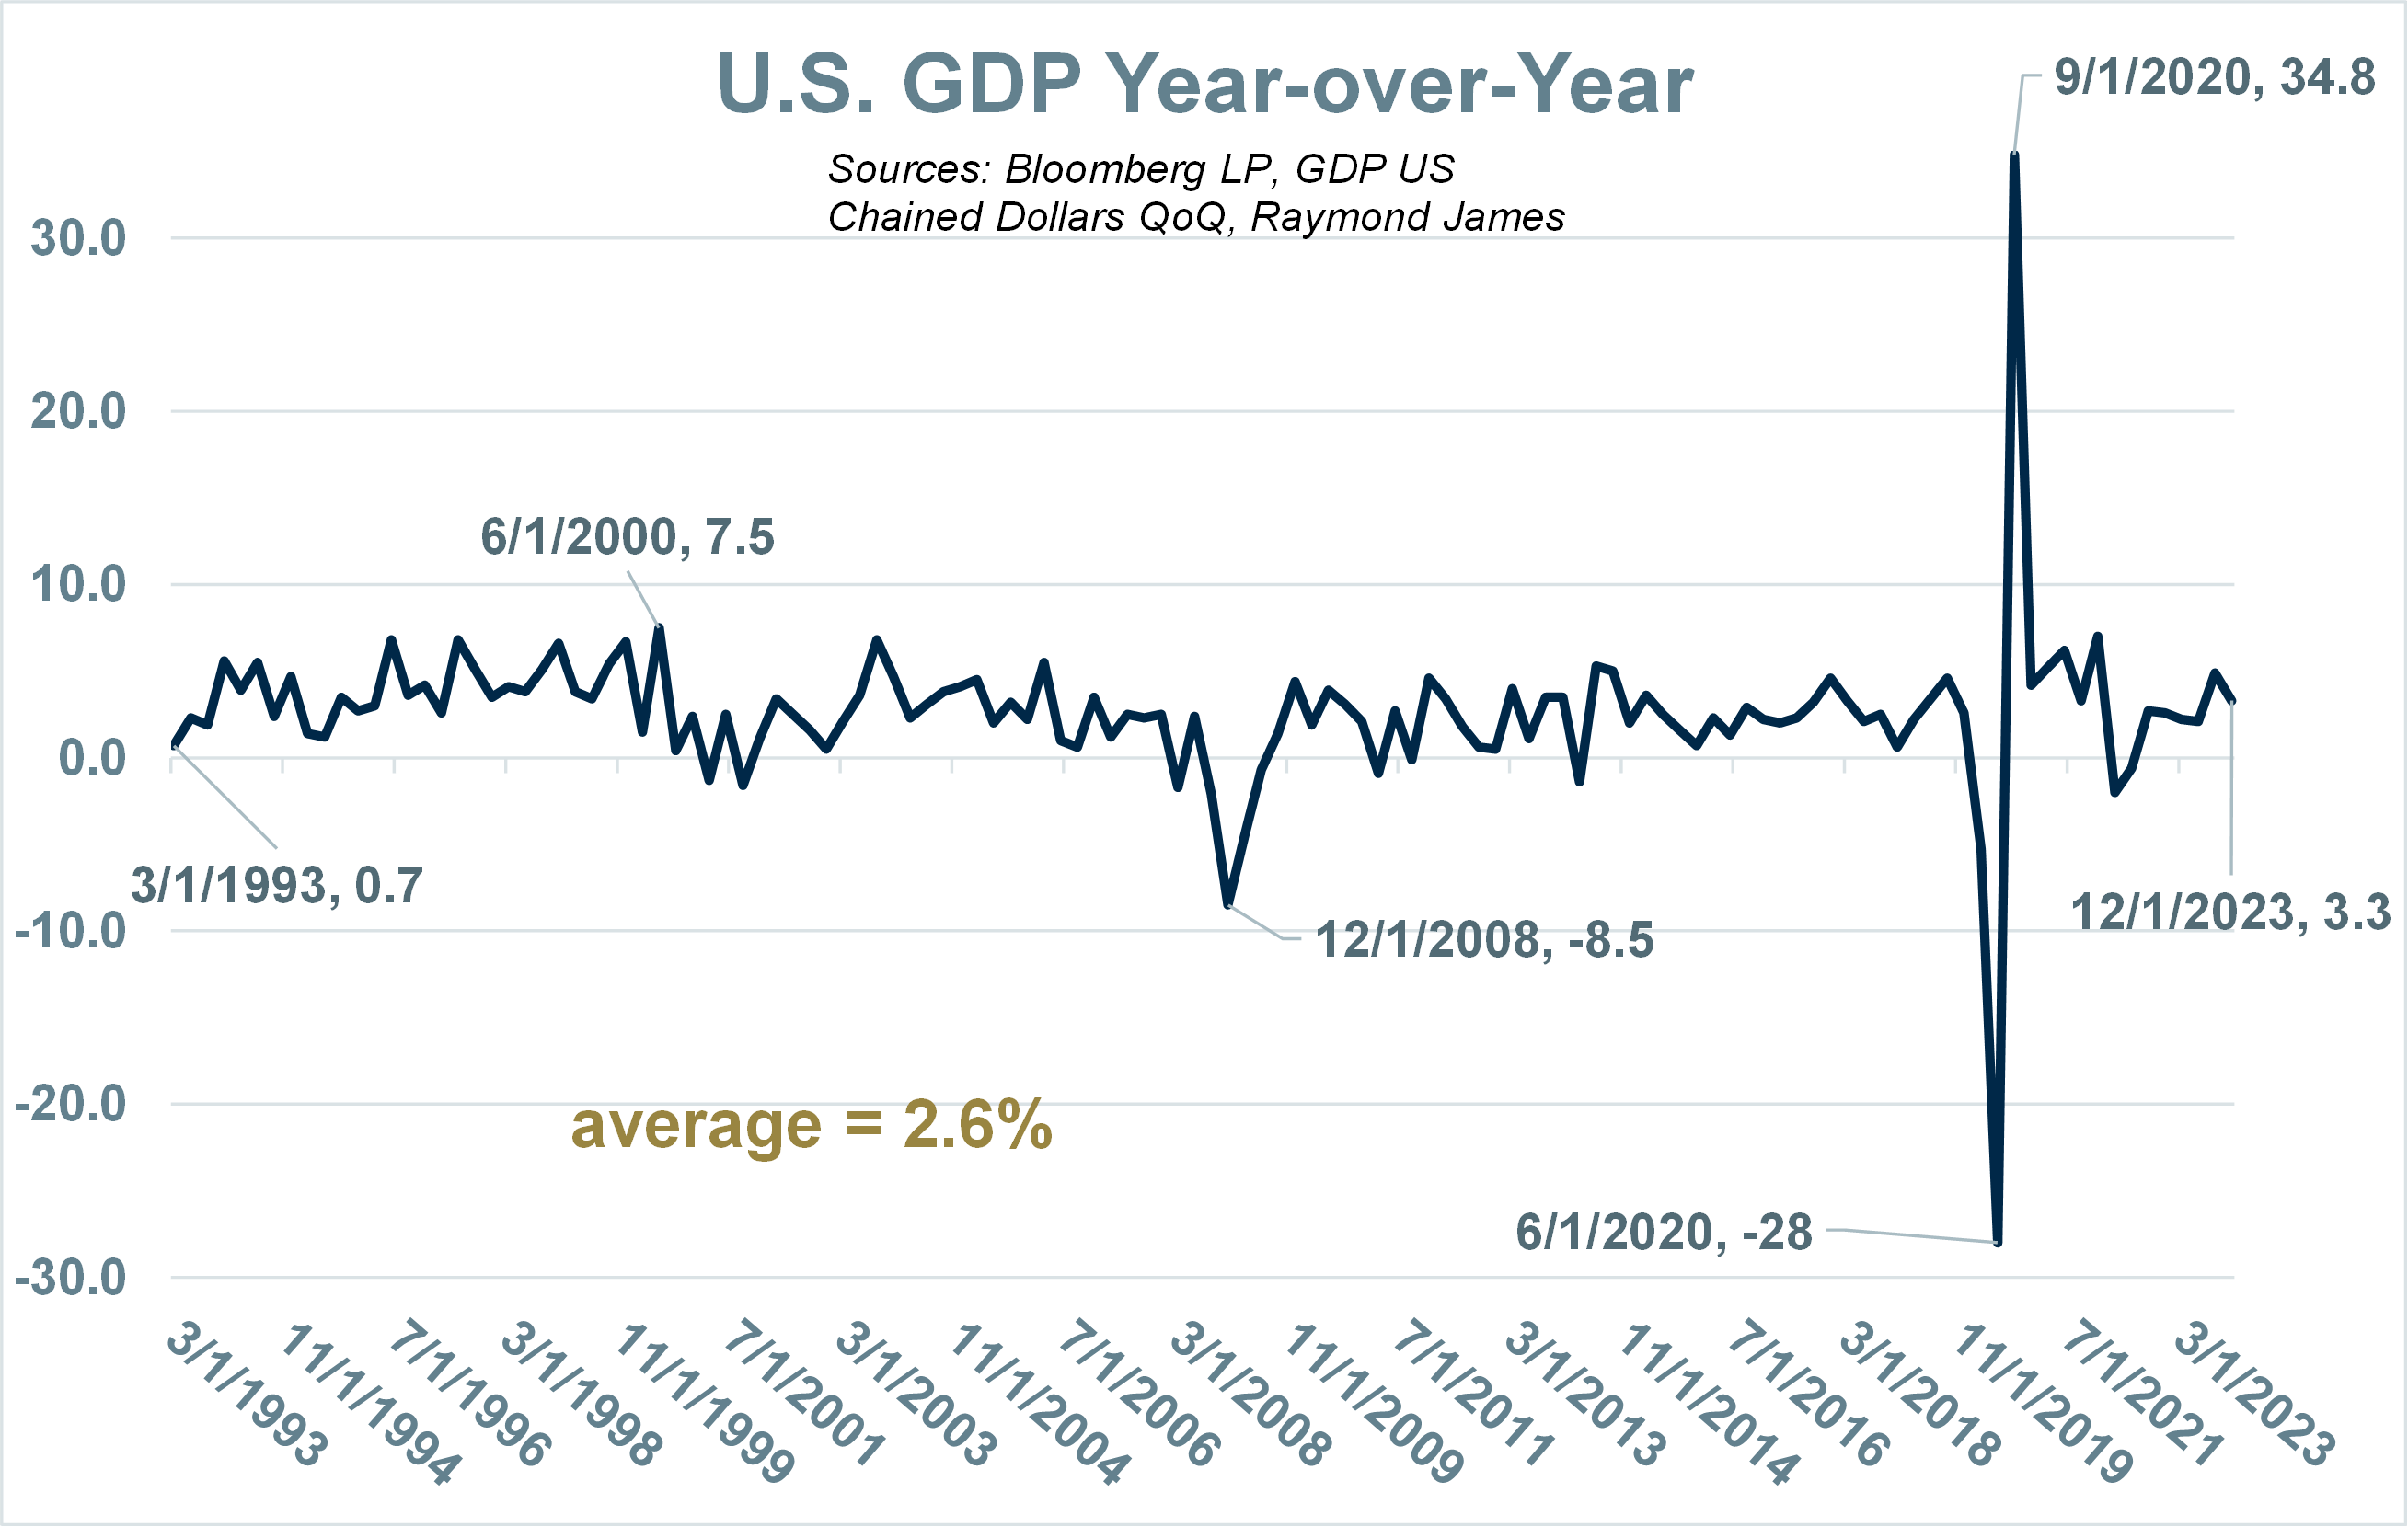
The good news is that the United States economy seems resilient in the aftermath of the world’s pandemic. The last Gross Domestic Product (GDP) released at 3.3% was roughly 27% above the last 30-year average.
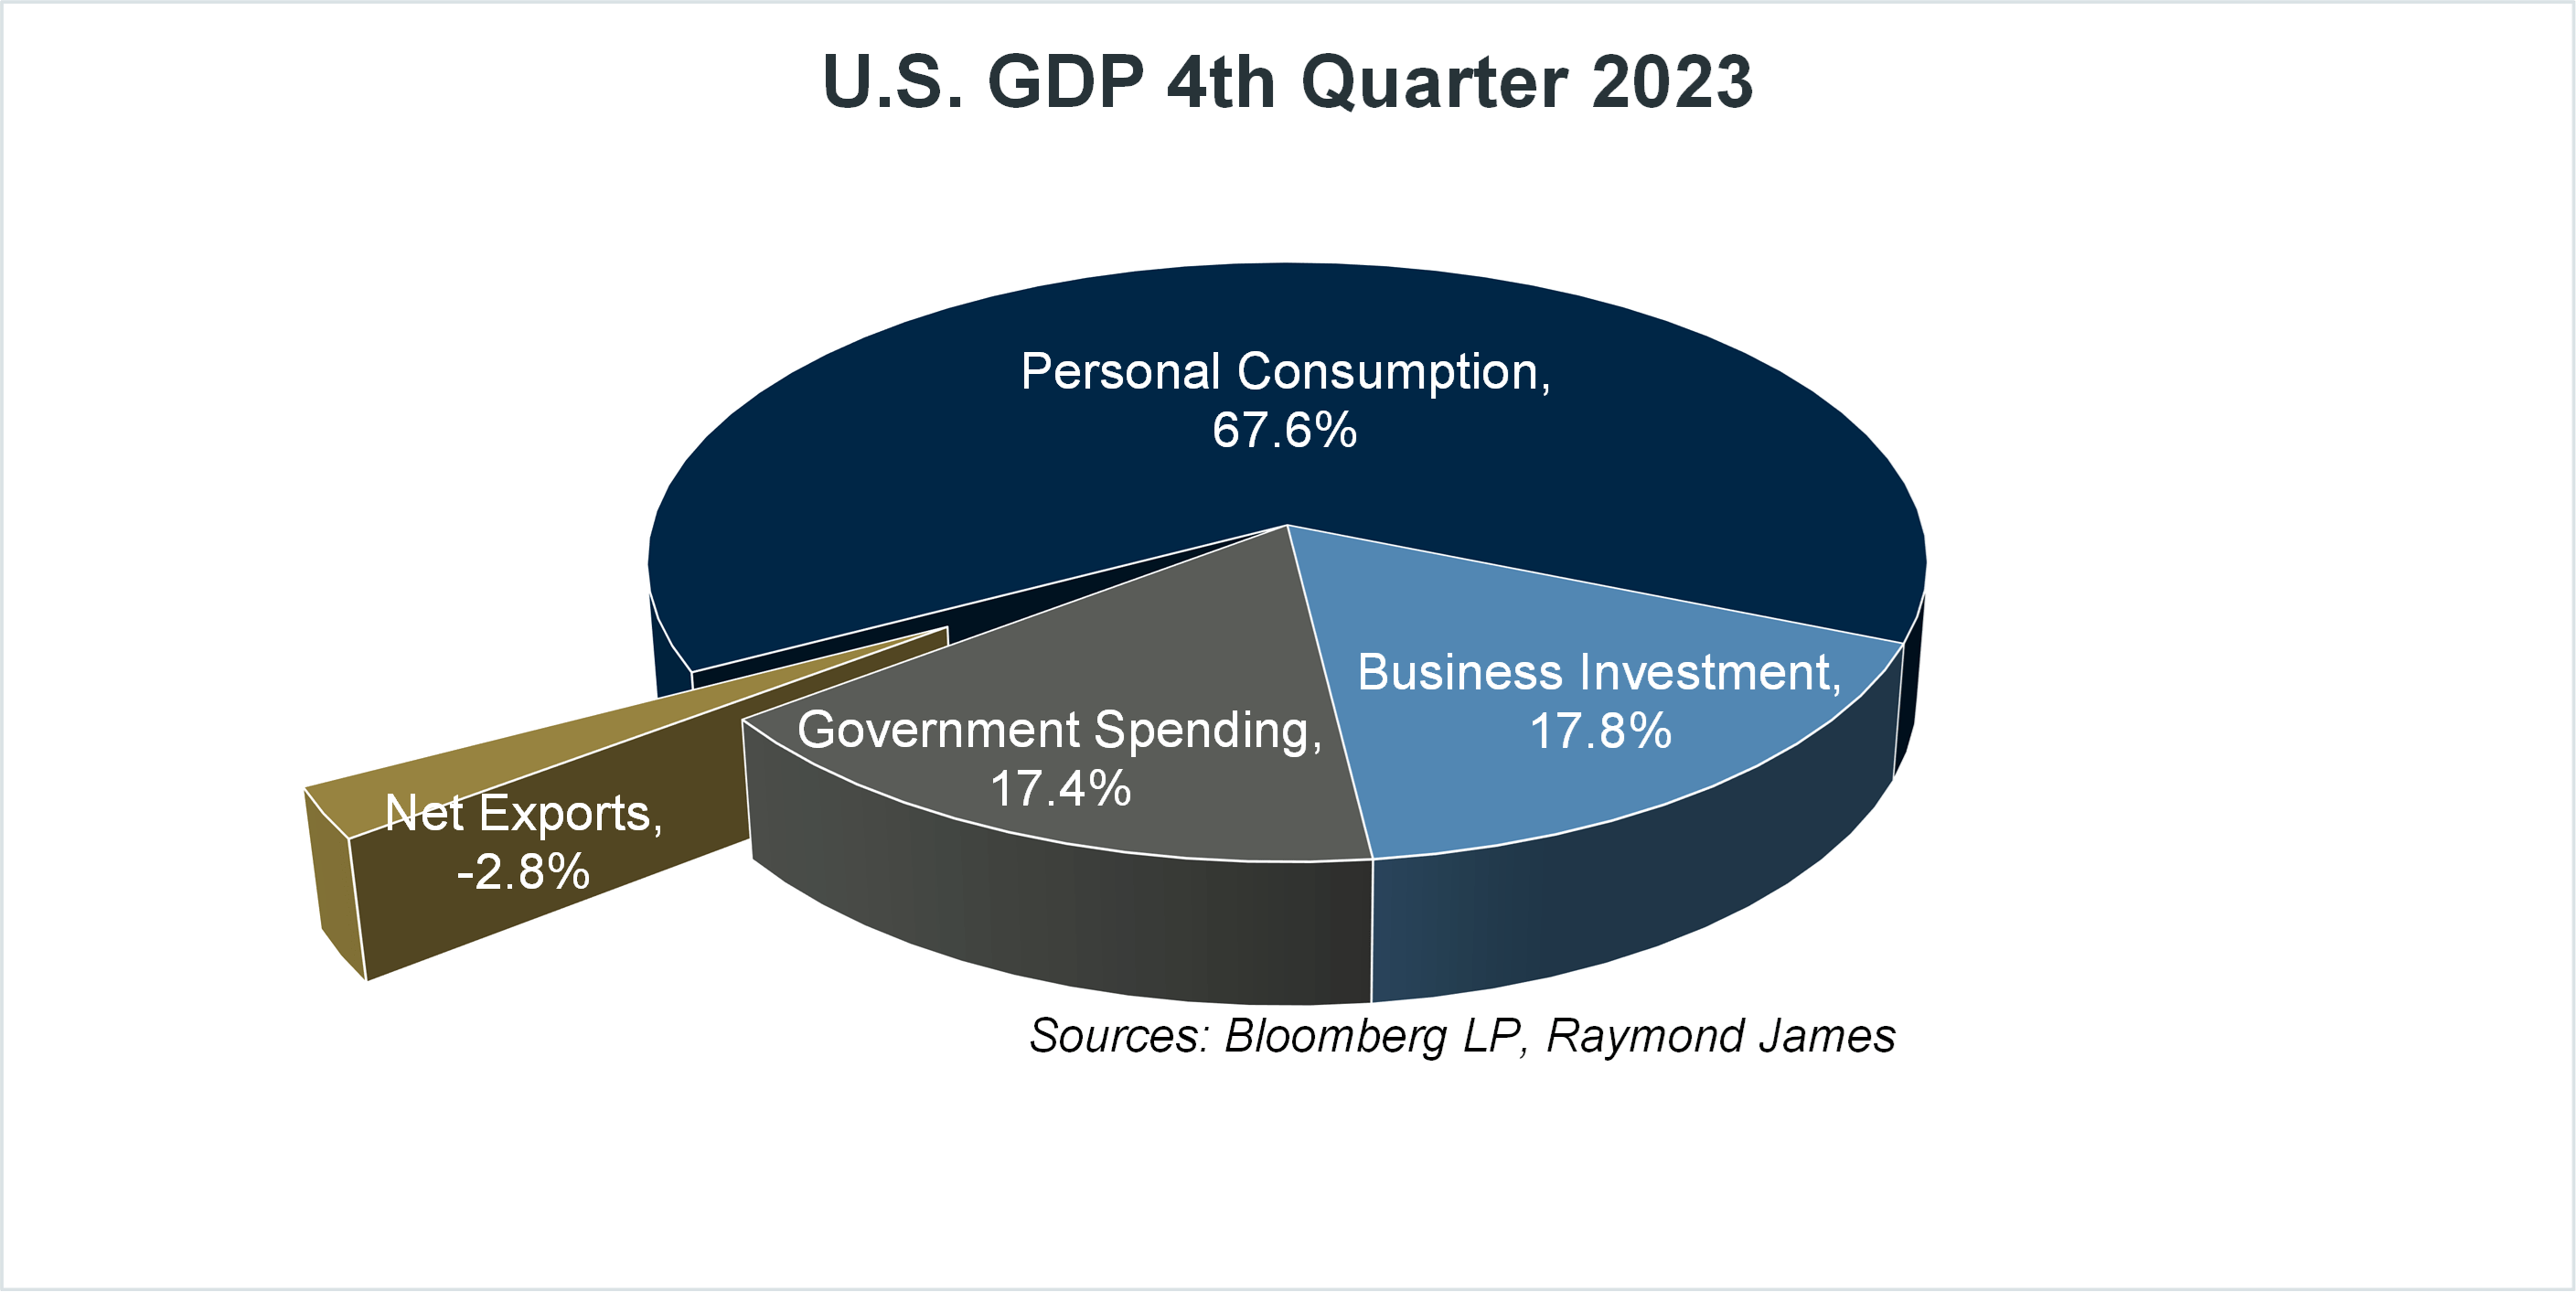
There are four components of GDP: Personal Consumption (consumer spending on goods and services), Investment (business spending on fixed assets and changes in private inventories), Government spending (spending by federal, state and local governments), and Net EXports (exports minus imports) or [C + I + G + NX = GDP].
The U.S. is sometimes referred to as a consumer-driven economy denoting that nearly 70% of the nation’s GDP is designated as personal consumption. But the truth is that the components of GDP overlap and attributing a cause-and-effect designation to any isolated component is like isolating a grain of sand. Without company investment in products and services, consumers don’t have goods to purchase. Consumer demand does not necessarily translate to increased employment. Employees are expensive investments for companies so temporary demand will not necessarily trigger business hires. Conversely, economic trouble, such as a pandemic, can push businesses to reduce costs or spending or worse, shutdowns. The 2020 pandemic-driven business retrenchment led to a recession - but a very short one. Why did the economy escape a deep long-drawn-out recession? It can be argued that policy-induced resources kept the economy from total collapse. Government intervention provided household income support in the form of direct cash and debt deferral or outright dismissal. In all, the federal government made $2.6 trillion in funds available. Cash infusion of this magnitude does not disperse so easily.
The extraordinary efforts made to support the U.S. economy and financial system through the COVID pandemic have led to strong economic growth over the past few years, even relative to other developed economies around the world. The U.S. economy is up over 5% compared to pre-COVID numbers even after factoring in the extraordinary levels of inflation experienced over the same timeframe. Using the same methodology and adjusting for inflation, the economic output of Japan, the United Kingdom, and the Eurozone are all < 1% higher than pre-COVID. Whether the stimulus to the U.S. economy helped us completely escape a deep recession or simply pushed it further into the future is yet to be determined.
Personal Savings
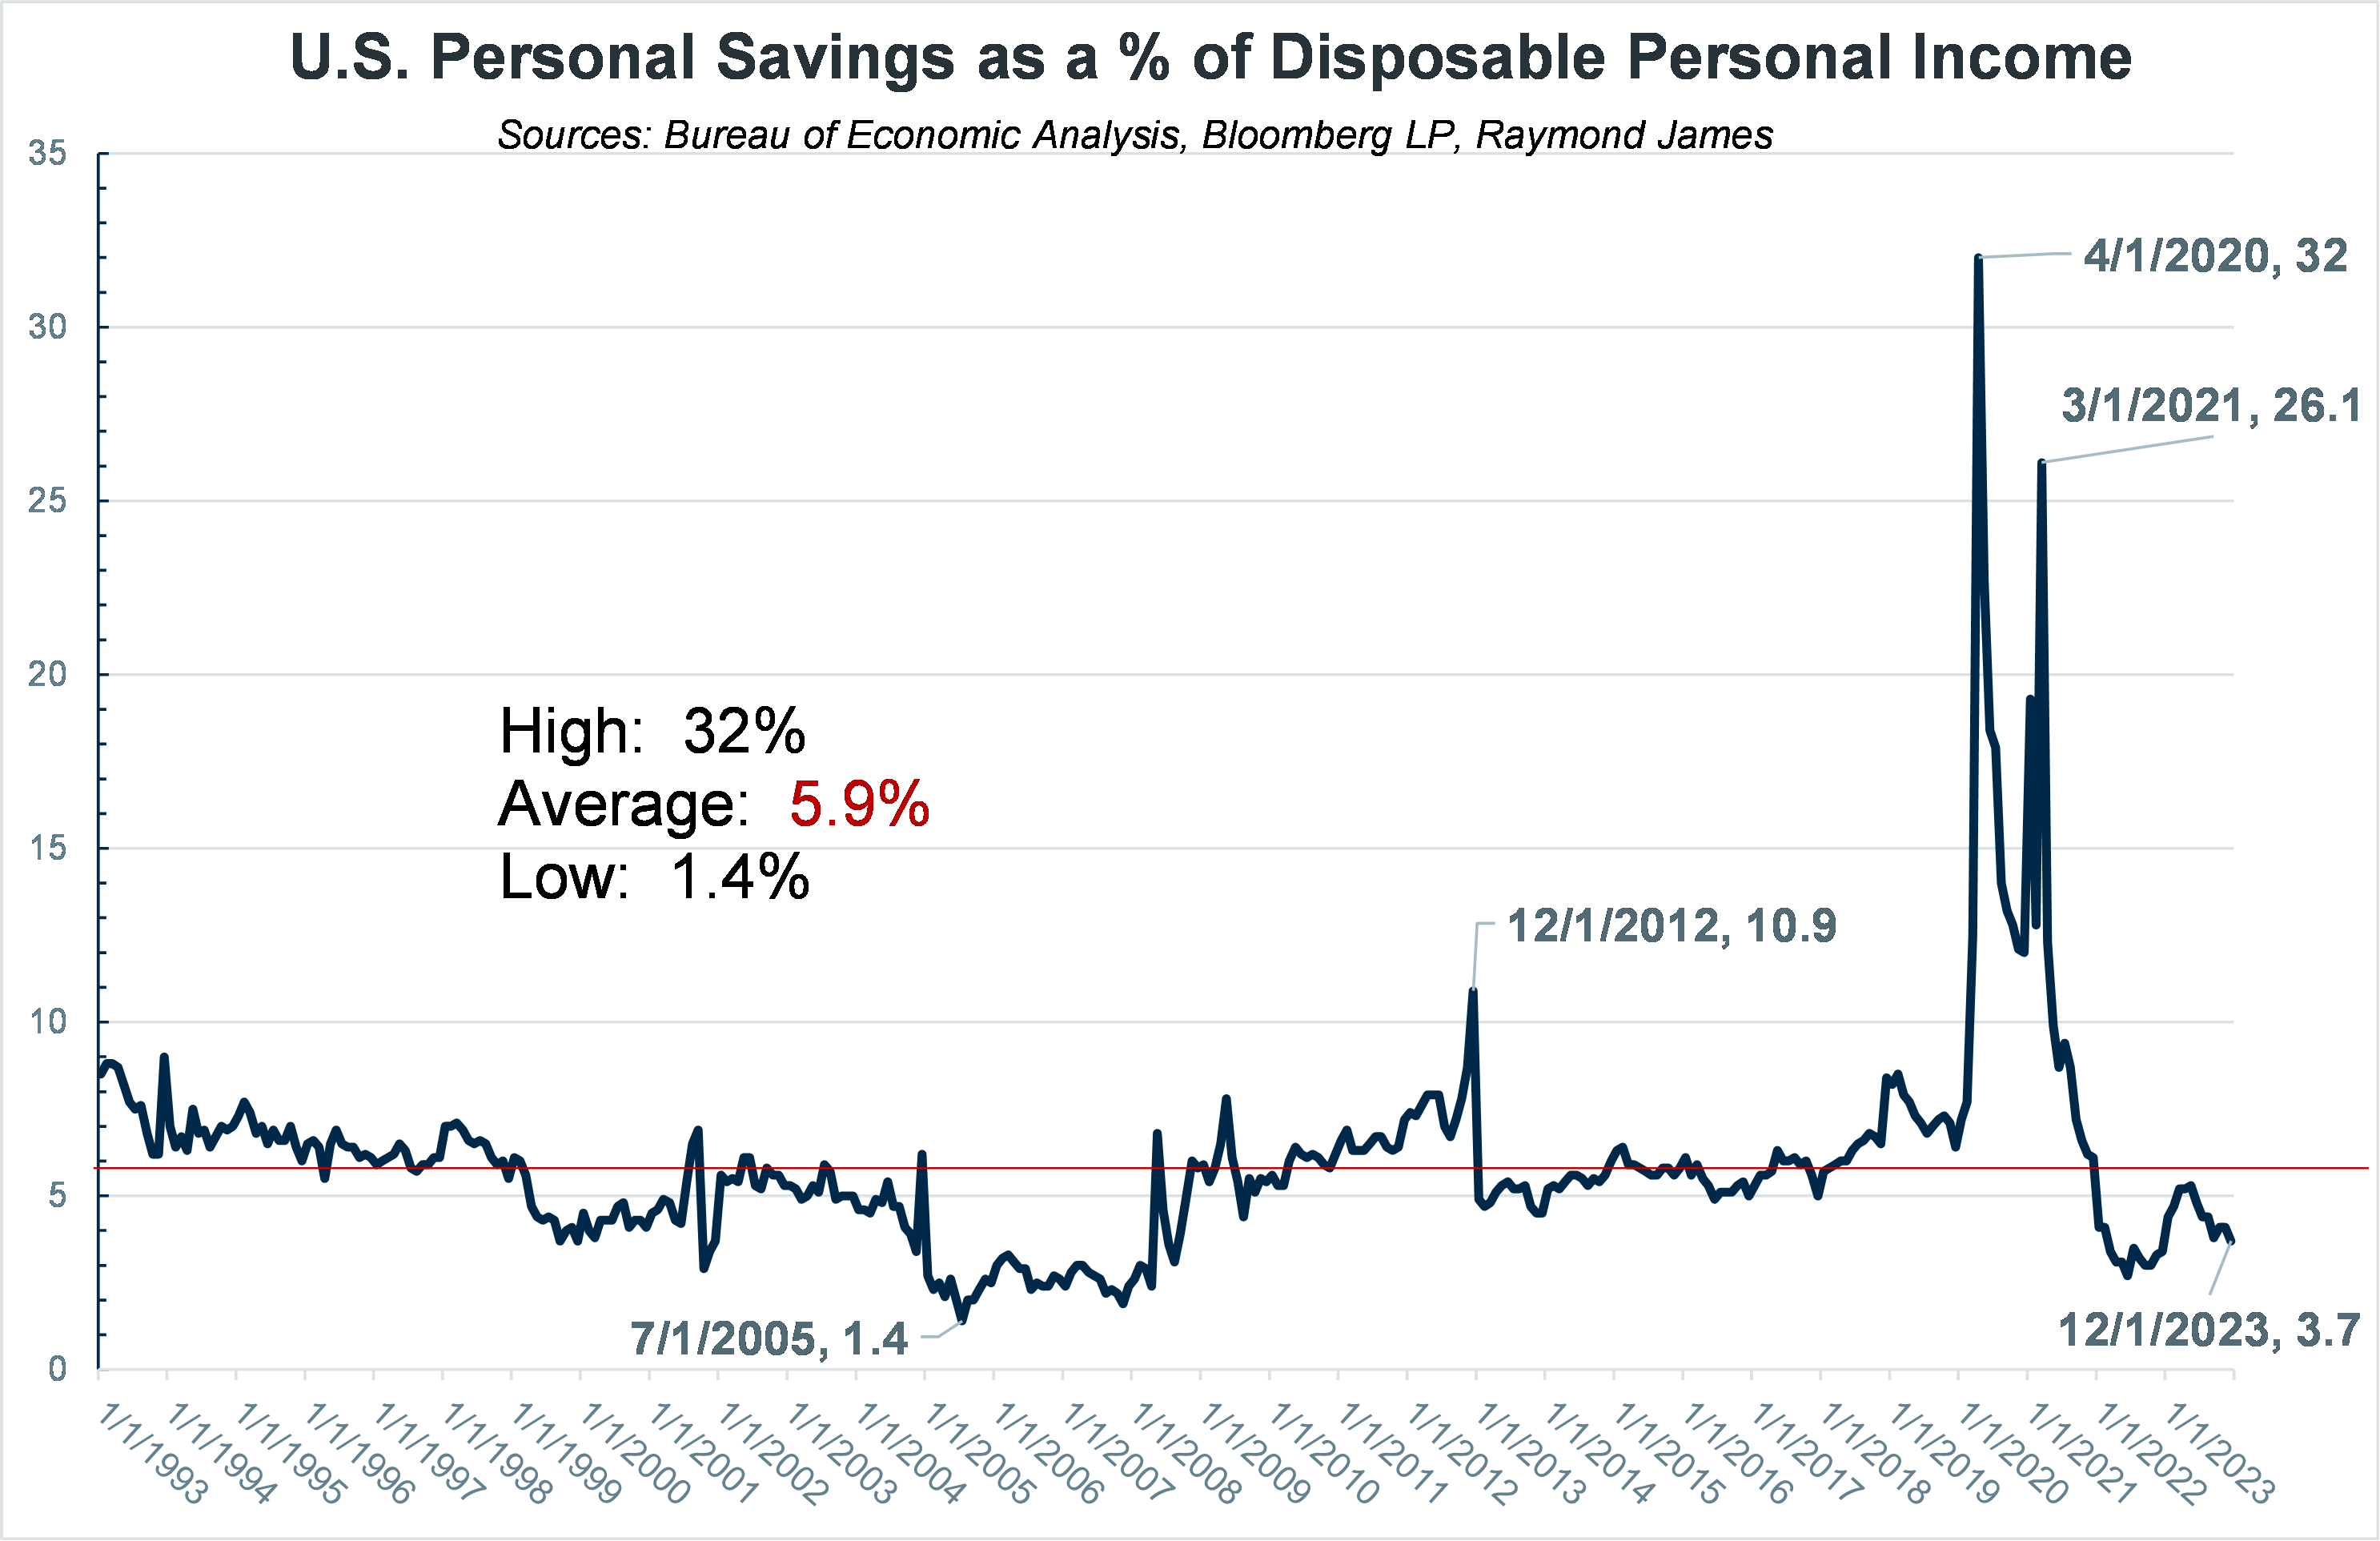
The government’s support combined with the business shutdowns gifted consumers with cash and deferred expenses but left consumers with limited outlets with which to spend it. The circumstance led to abnormally high levels of excess personal savings. Understanding of and constraints on the pandemic took hold and from mid-year 2021 through mid-year 2022, consumers spent money at a rapid pace, more than making up for their forced sideline retreat. Average savings as a percent of disposable income fell below 30-year averages. In itself, falling savings sums are not all damaging. After all, consumer spending is a major component that has helped to hoist the U.S. GDP to harmonious levels. However, continued savings depletion combined with growing debt may have consequences that have not surfaced yet. And it is not only consumer debt but government debt that is on the rise.
To put some global context on household savings, the Eurozone, United Kingdom, France, Germany, South Africa and Canada all boast higher current savings now versus pre-COVID. Japan and the United States are two countries with lower savings now when compared to pre-COVID levels. The level of savings is not as important as the answer explaining why savings are directionally headed down. Are U.S. consumers spending on borrowed dollars? Wages are not keeping pace with spending pushing savings down and debt up.
Wages, Earnings & Spending
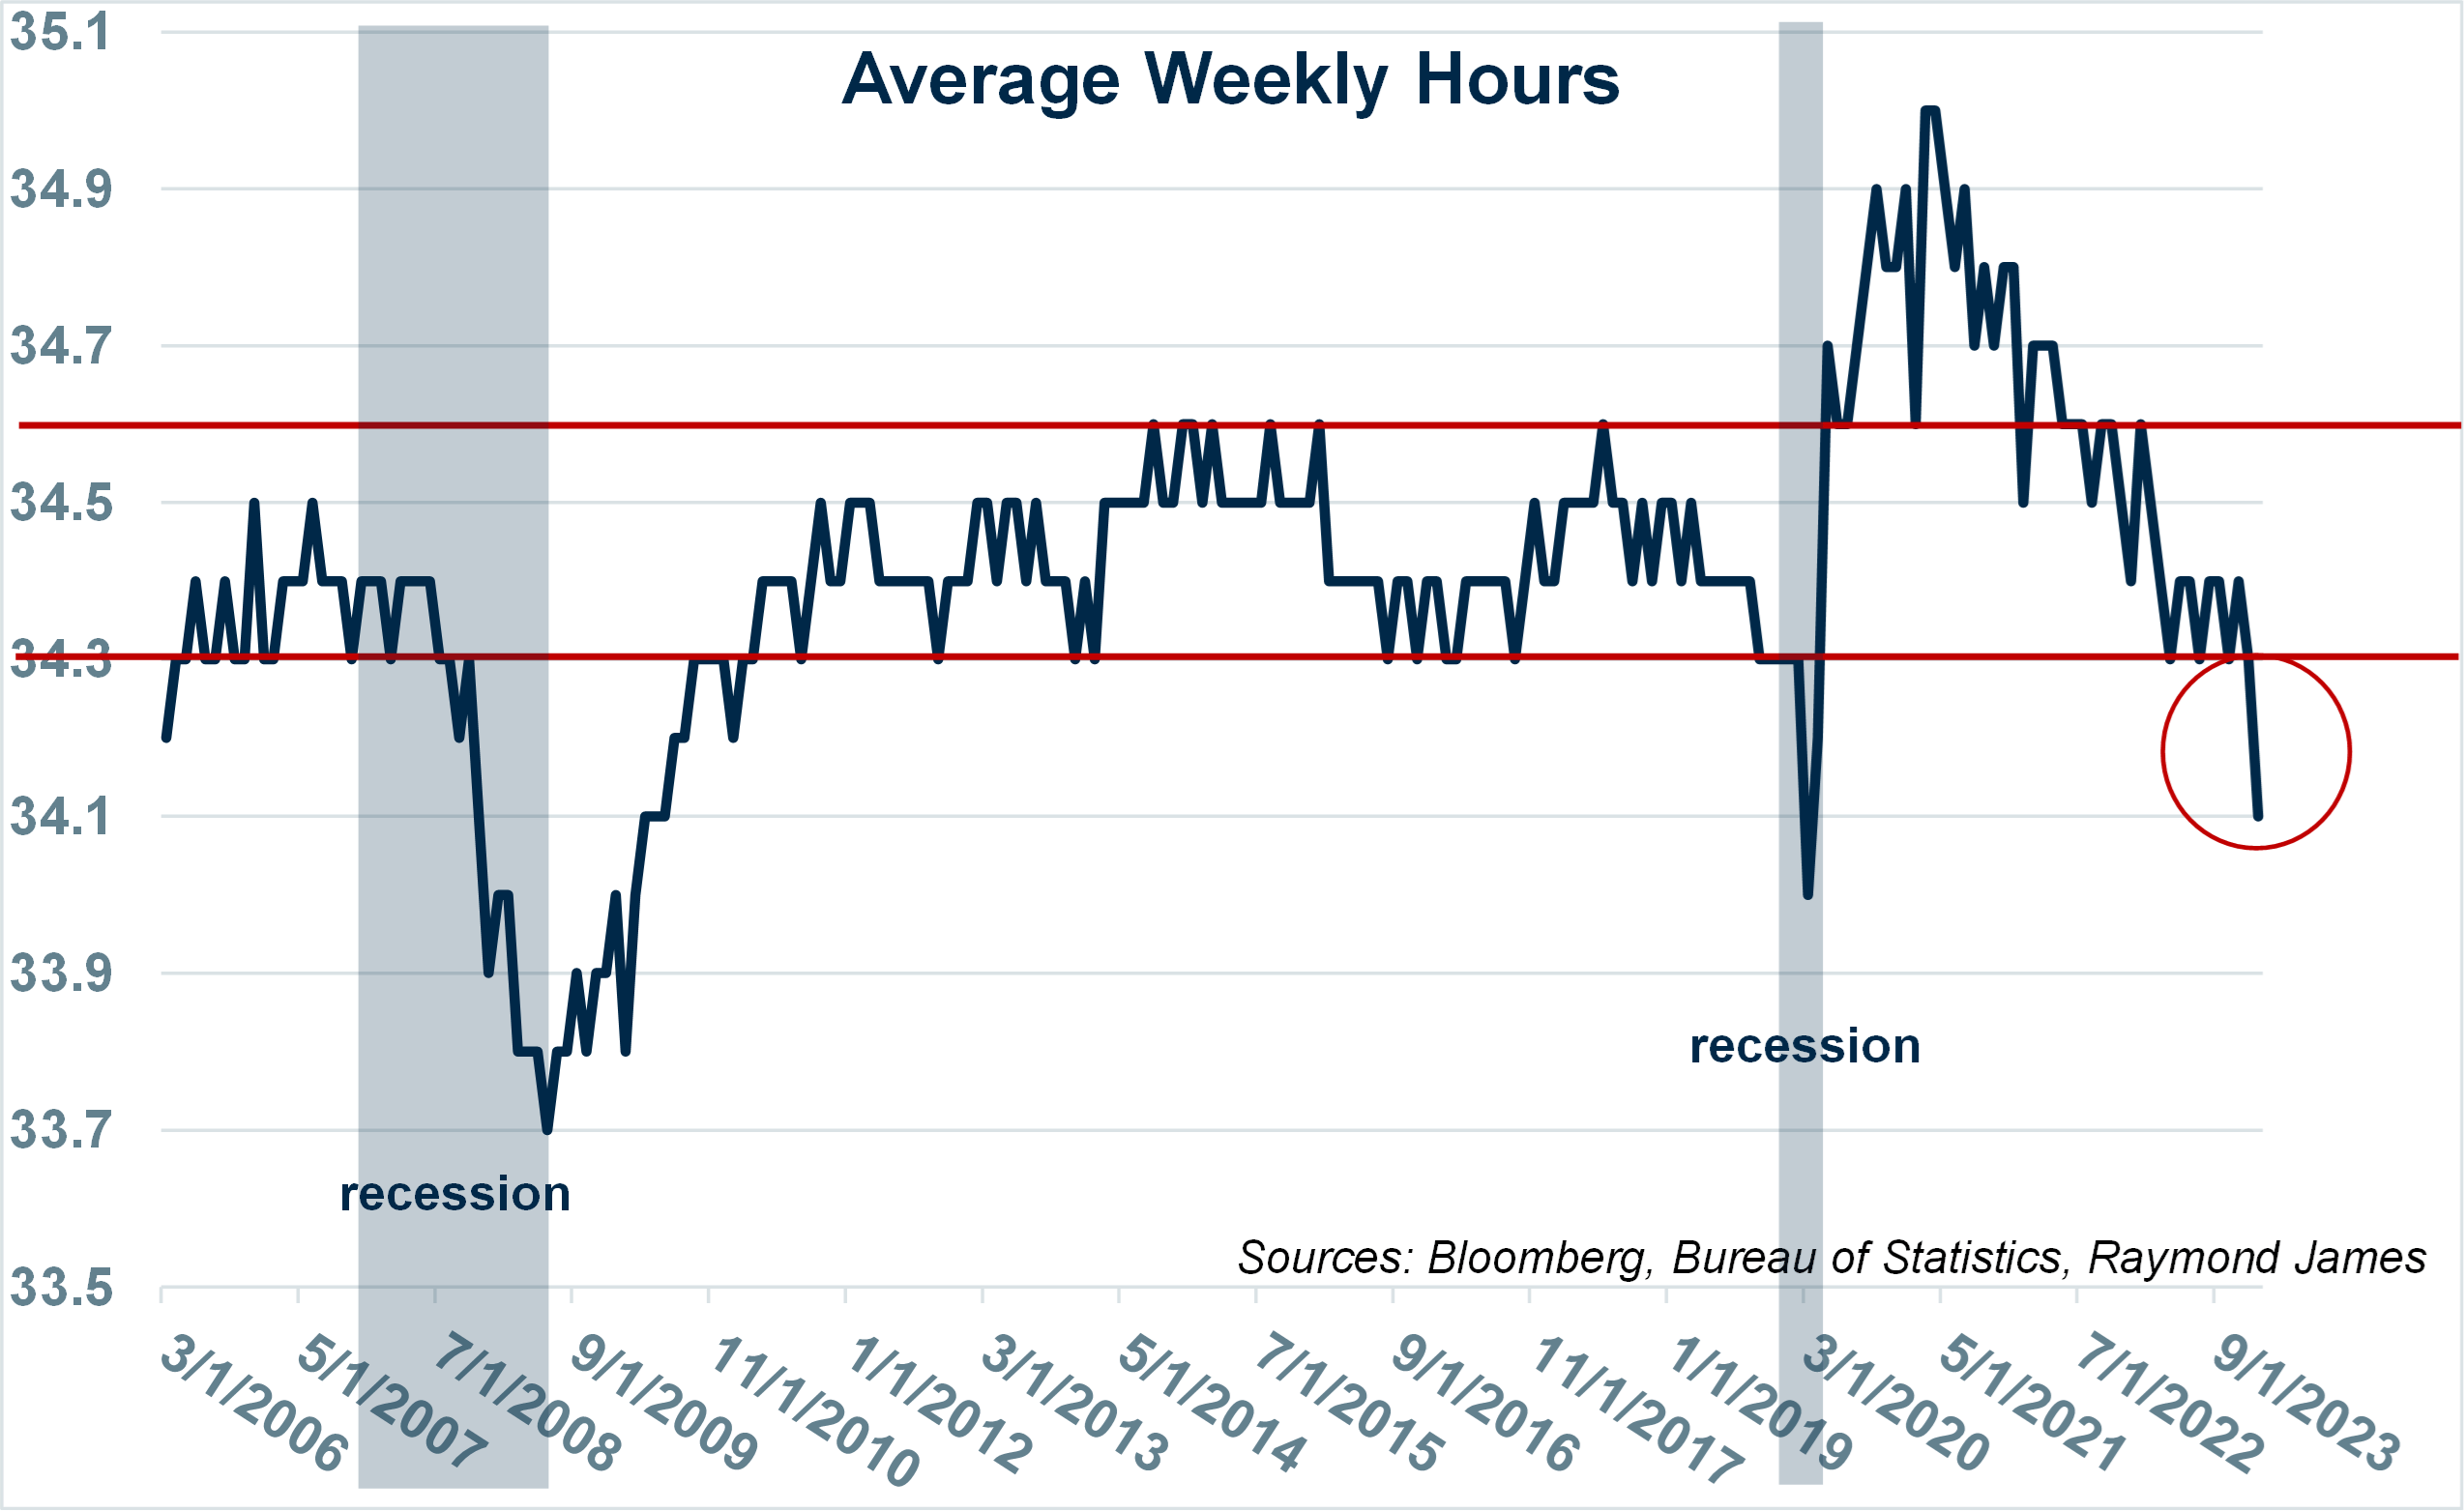
The numbers get tough to digest and I would suggest that nearly every opinion can be backed by choosing the right set of data. For example, the recent average hourly earnings releases were positive or up. Yet the trend since March 2022 has been down. In addition, the average weekly hours worked was down. Other than the present, there are only 2 ranges of time where the average weekly hours of employees have dipped below 34.3 and each of the last two times it was during a recession. Even if workers earn more per hour, the number of hours worked helps determine net earnings. Since production is up, it can be rationalized that workers are being more productive working fewer hours and taking home less money relative to their production. The following chart reveals another cautionary signal. When consumer spending exceeds wage growth, consumers are either borrowing money (going deeper into debt) or depleting savings. Earnings relative to consumer spending are currently very tight.

Employment
The change in the Nonfarm Payroll index has been very positive lately, indicating a strong job market. According to certain employment data releases, the economy is pushing along at full employment. There are, however, different employment indicators that build an apprehension against being too comfortable with headline euphoria. The household survey and payroll survey numbers don’t sync. The payroll survey counts jobs while the household survey counts the number of employed individuals. Someone holding several jobs will be counted several times in the payroll survey but once in the household survey.
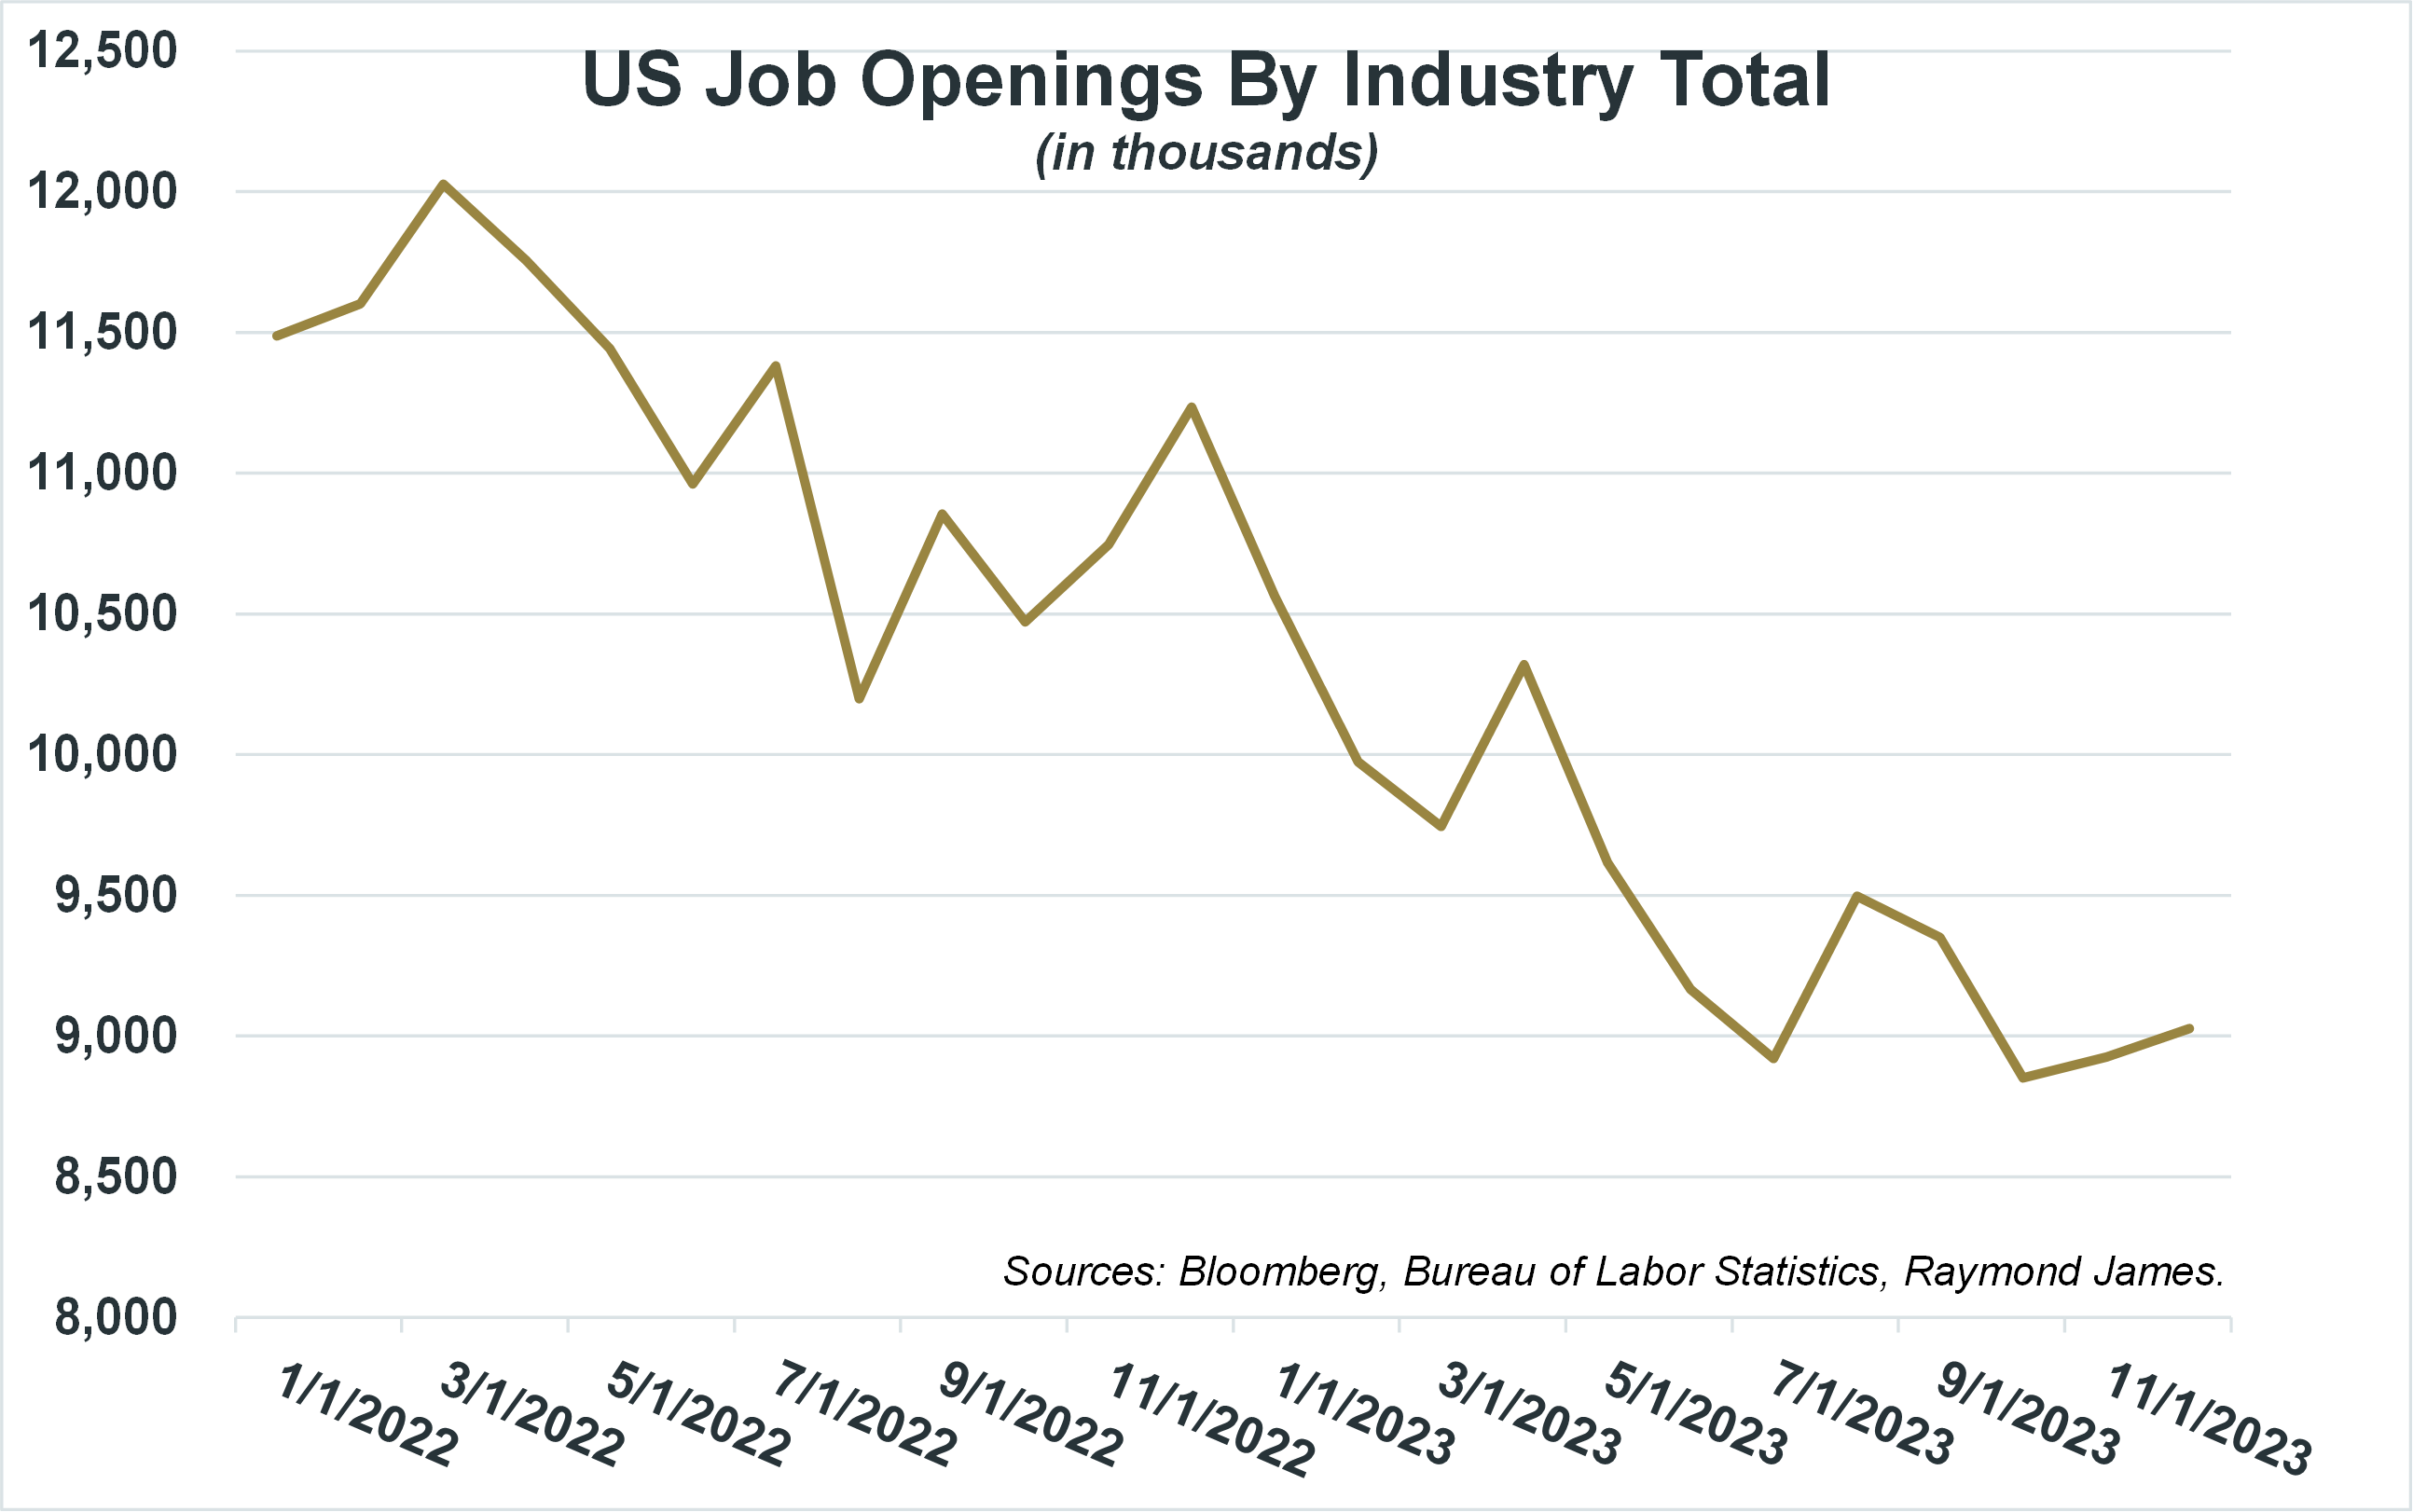
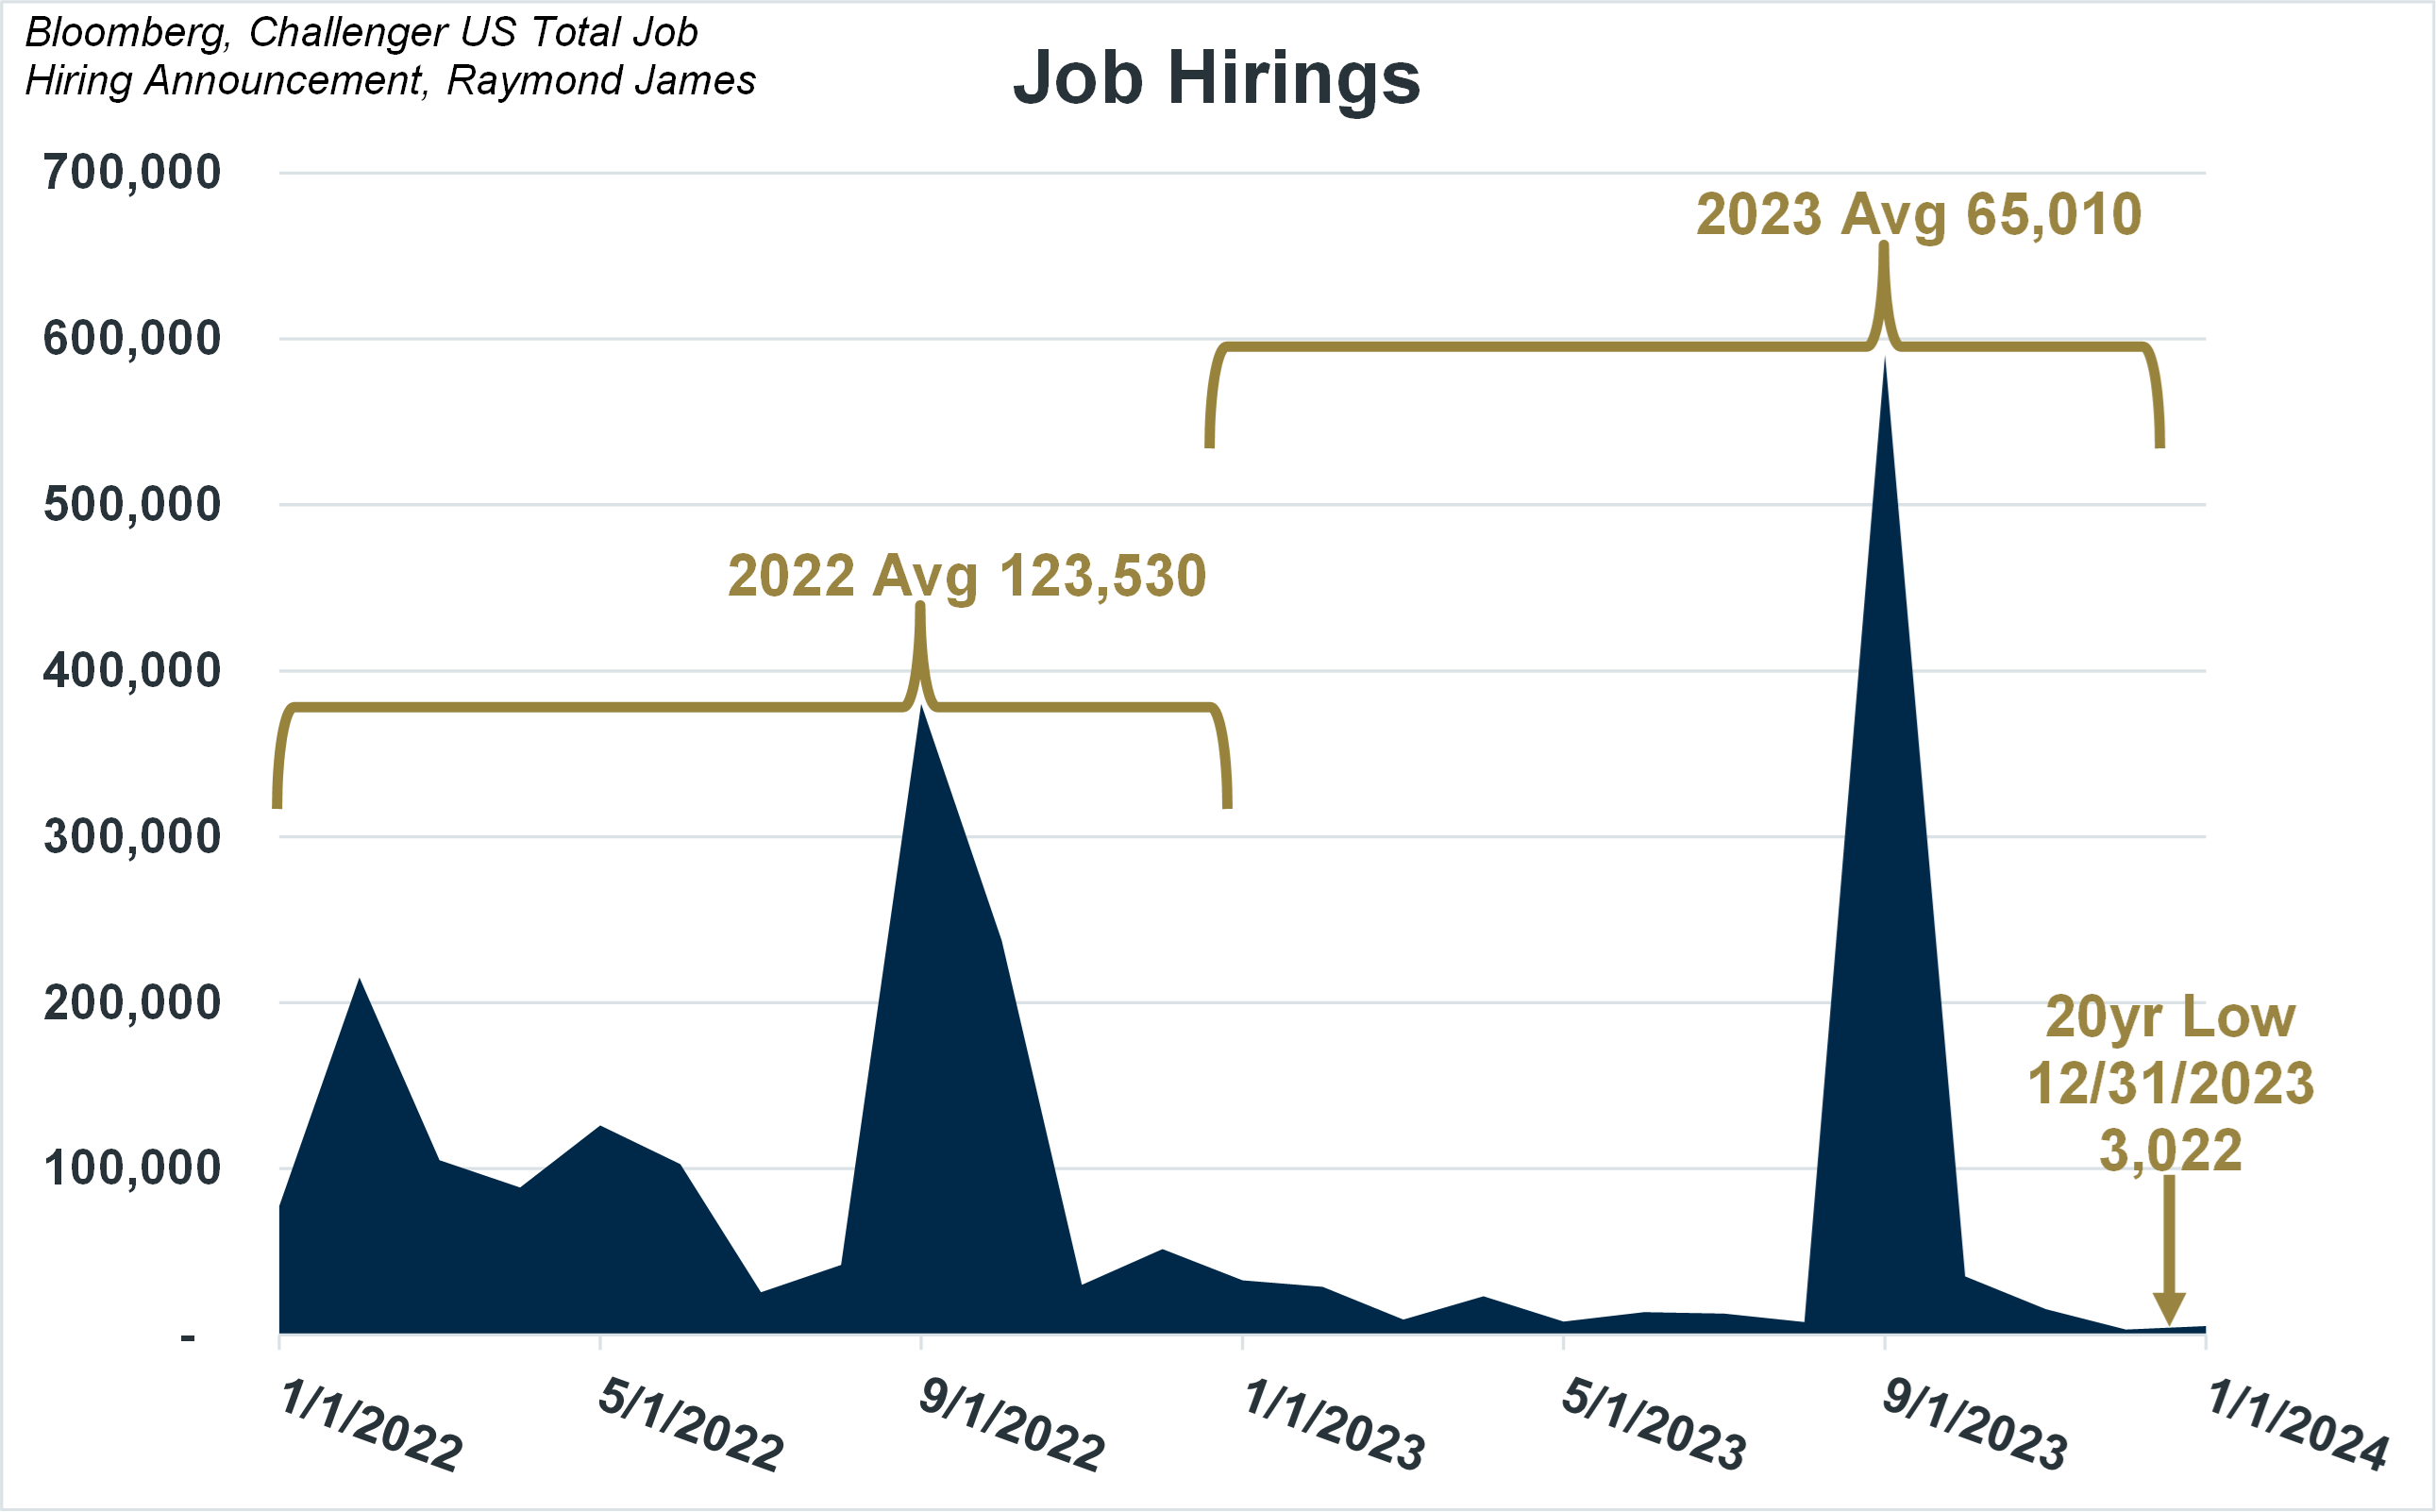
The JOLTS (U.S. job openings by industry total) has declined since 2022. The Challenger US Total Job Hiring Announcement which tracks additions to the payroll that occur hit an all-time low in December (the number has been tracked for 20 years). Adding to the confusion are reports of layoffs in multiple sectors such as IT and journalism.
Unemployment numbers are not driven by demand but instead are a function of unemployment eligibility. During COVID, many eligible laid-off workers exhausted their eligibility for unemployment benefits; therefore, if they are unemployed now, they are not counted. New entrants to the job market are also not eligible.
According to the Challenger US Total Job Hiring Announcement, fewer jobs are being added by employers. The average number of additions to the payroll was nearly halved in 2023 from 2022. December 2023 marked a 20-year low.
Another data point that is difficult to quantify but anecdotally could be very significant is the so-called ‘labor hoarding’ that has taken place since the COVID-19 pandemic. During the pandemic, due to a combination of factors, many companies had a very difficult time hiring the employees that they needed for their company to operate fully and efficiently. As a result and due to the shortage of eligible candidates, many companies have been reluctant to lay off workers even though they might not necessarily be needed right now to have a supply of labor should the hiring market get difficult again. When/if the economy takes a turn for the worse, the “regular” layoffs that take place during a recession could be multiplied due to the already over-staffed payrolls for many companies.
Debt
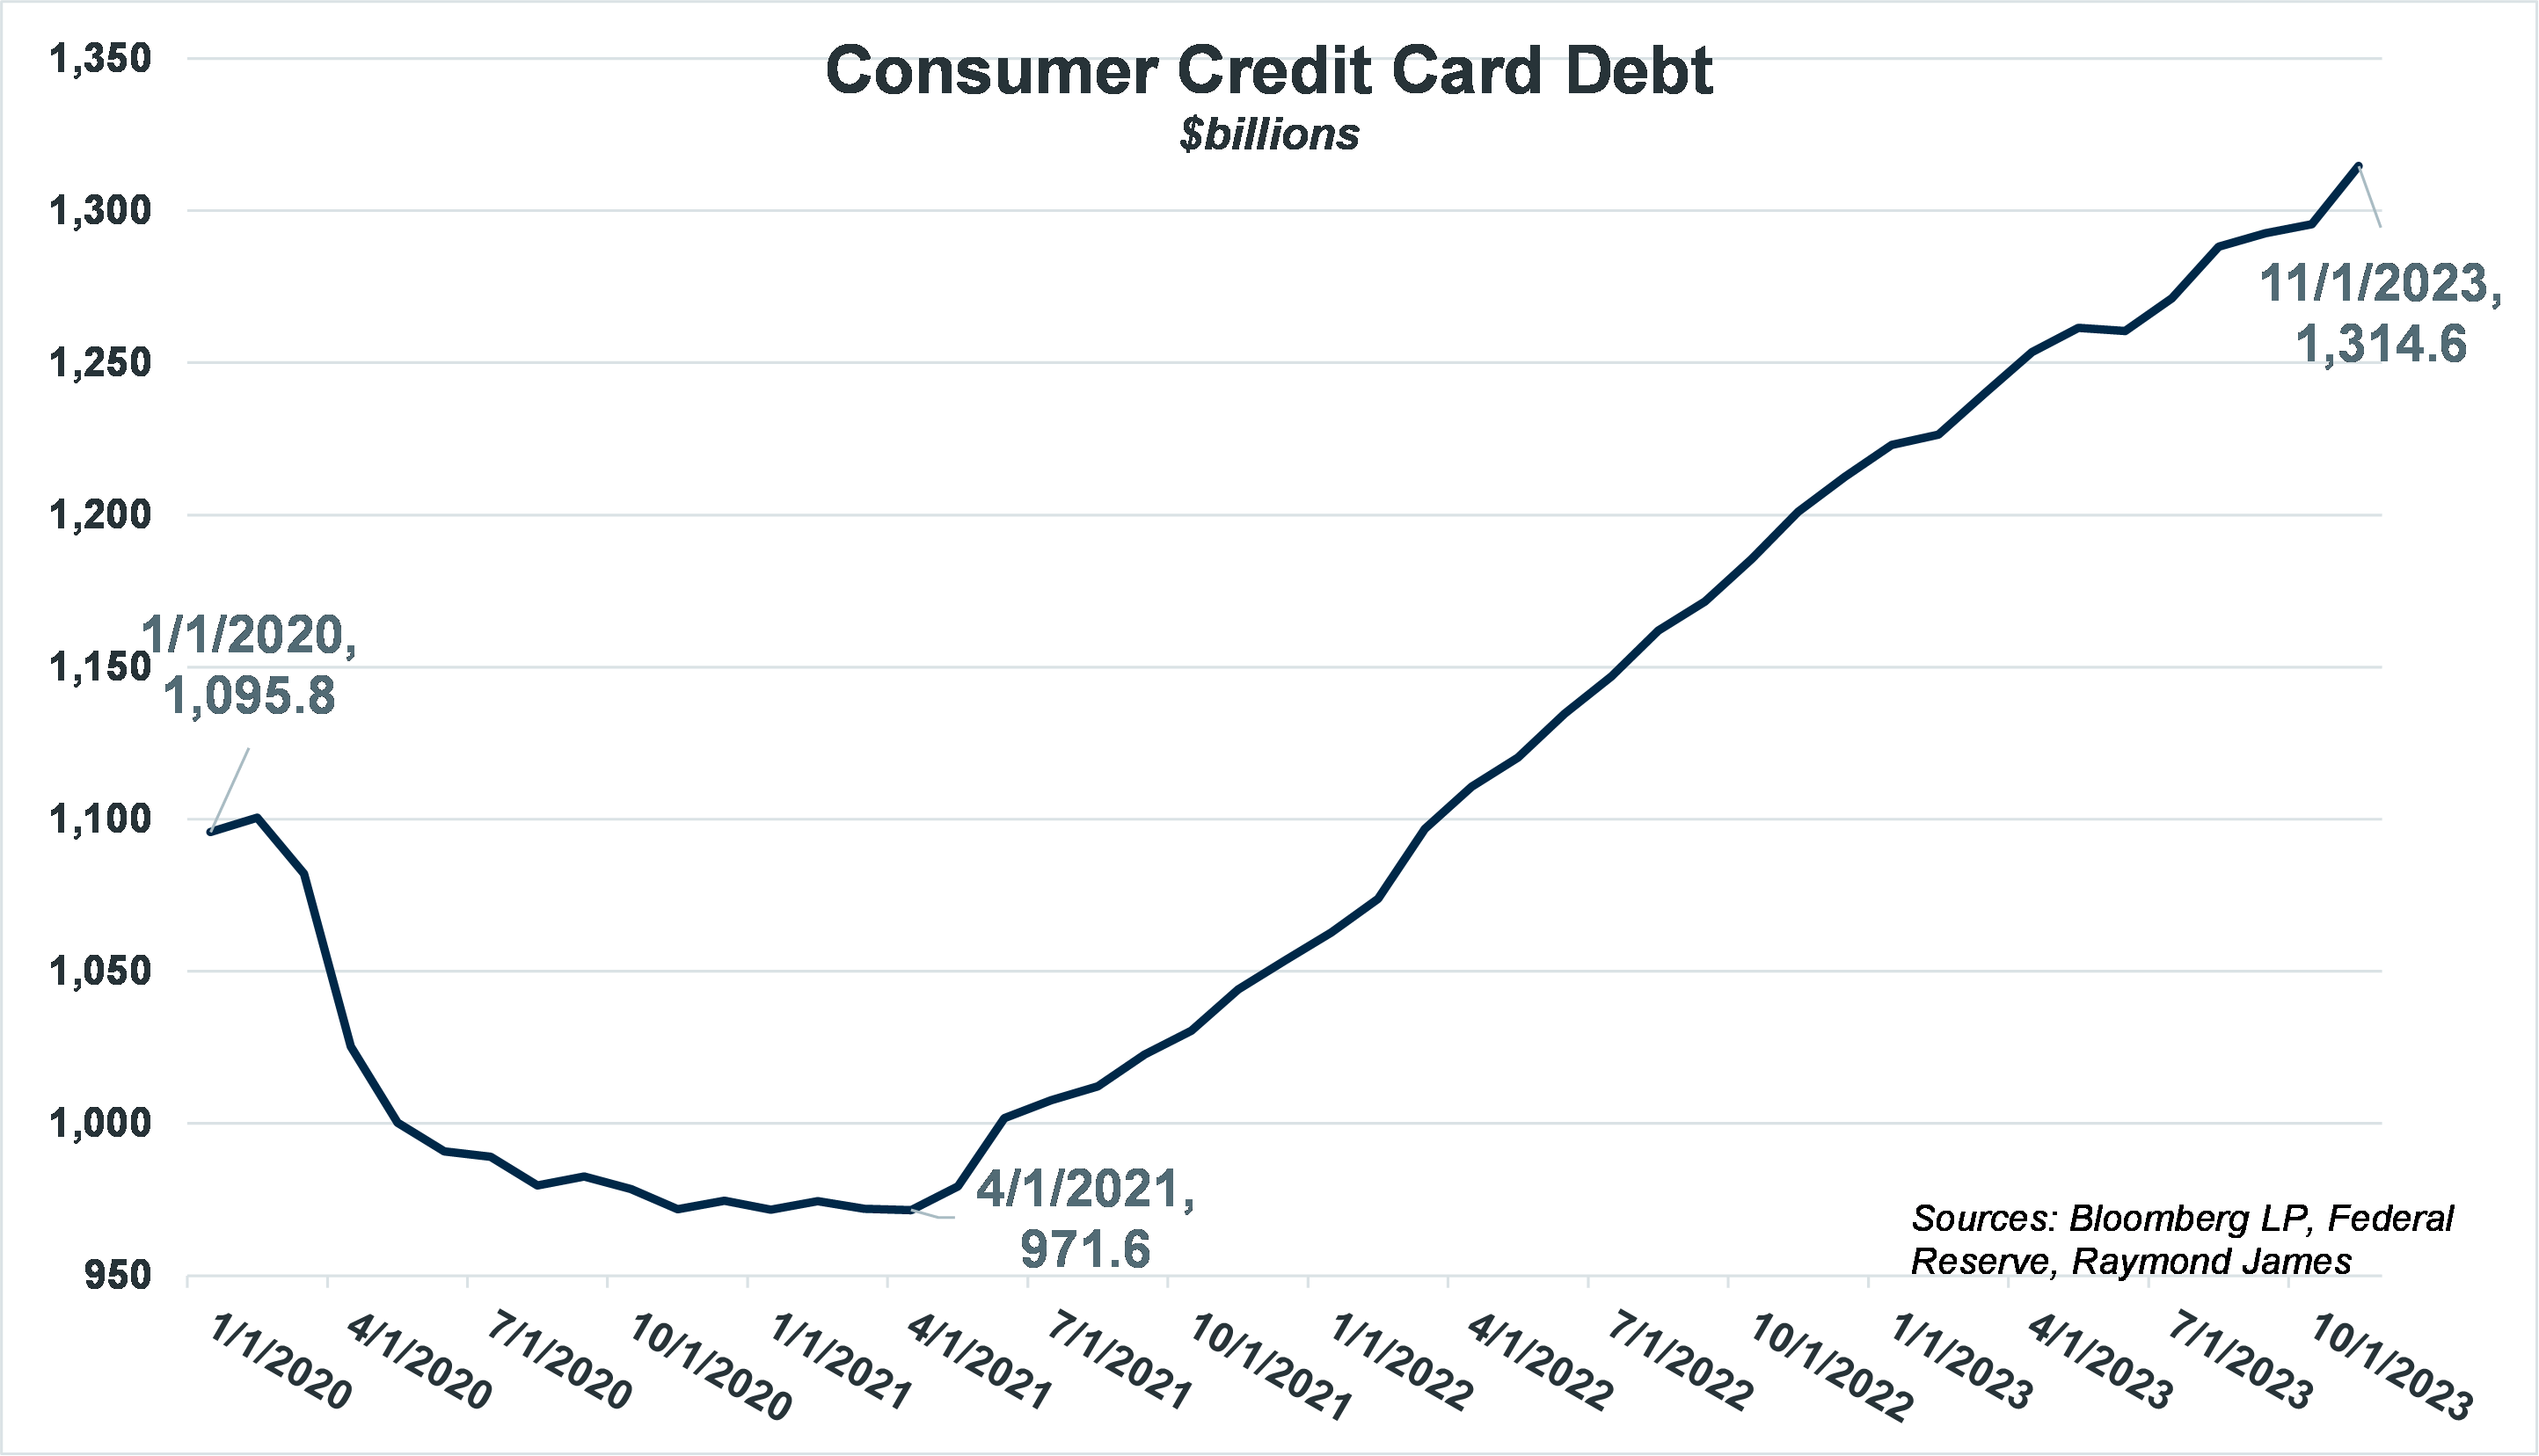
Consumer credit card (revolving) debt is more than 20% higher than pre-pandemic levels. The pace at which credit card debt has risen is alarming. Though the 30+ and 90+ day delinquency rates are below long-term averages, they have been on a steady rise since the middle of last year. Since hitting a 17-year low amid the 2021 pandemic, 90+ day delinquencies are up 83%. Delinquencies have maintained or increased in 23 of 28 months reported after the low in August 2021.
Mortgage debt has also been on the rise. Mortgage debt steadily increased from 2000 up to the Great Recession of 2008. The debt declined for a period between 2008 – 2014, before once again rising in 2015 and picking up the rate of increase from 2021 to the present. There now exists over $20 trillion in mortgage debt in the United States.

In the last 2 years, the average mortgage interest rate has increased from 3.3% to around 7%, thus making newly issued mortgage debt more costly to consumers.
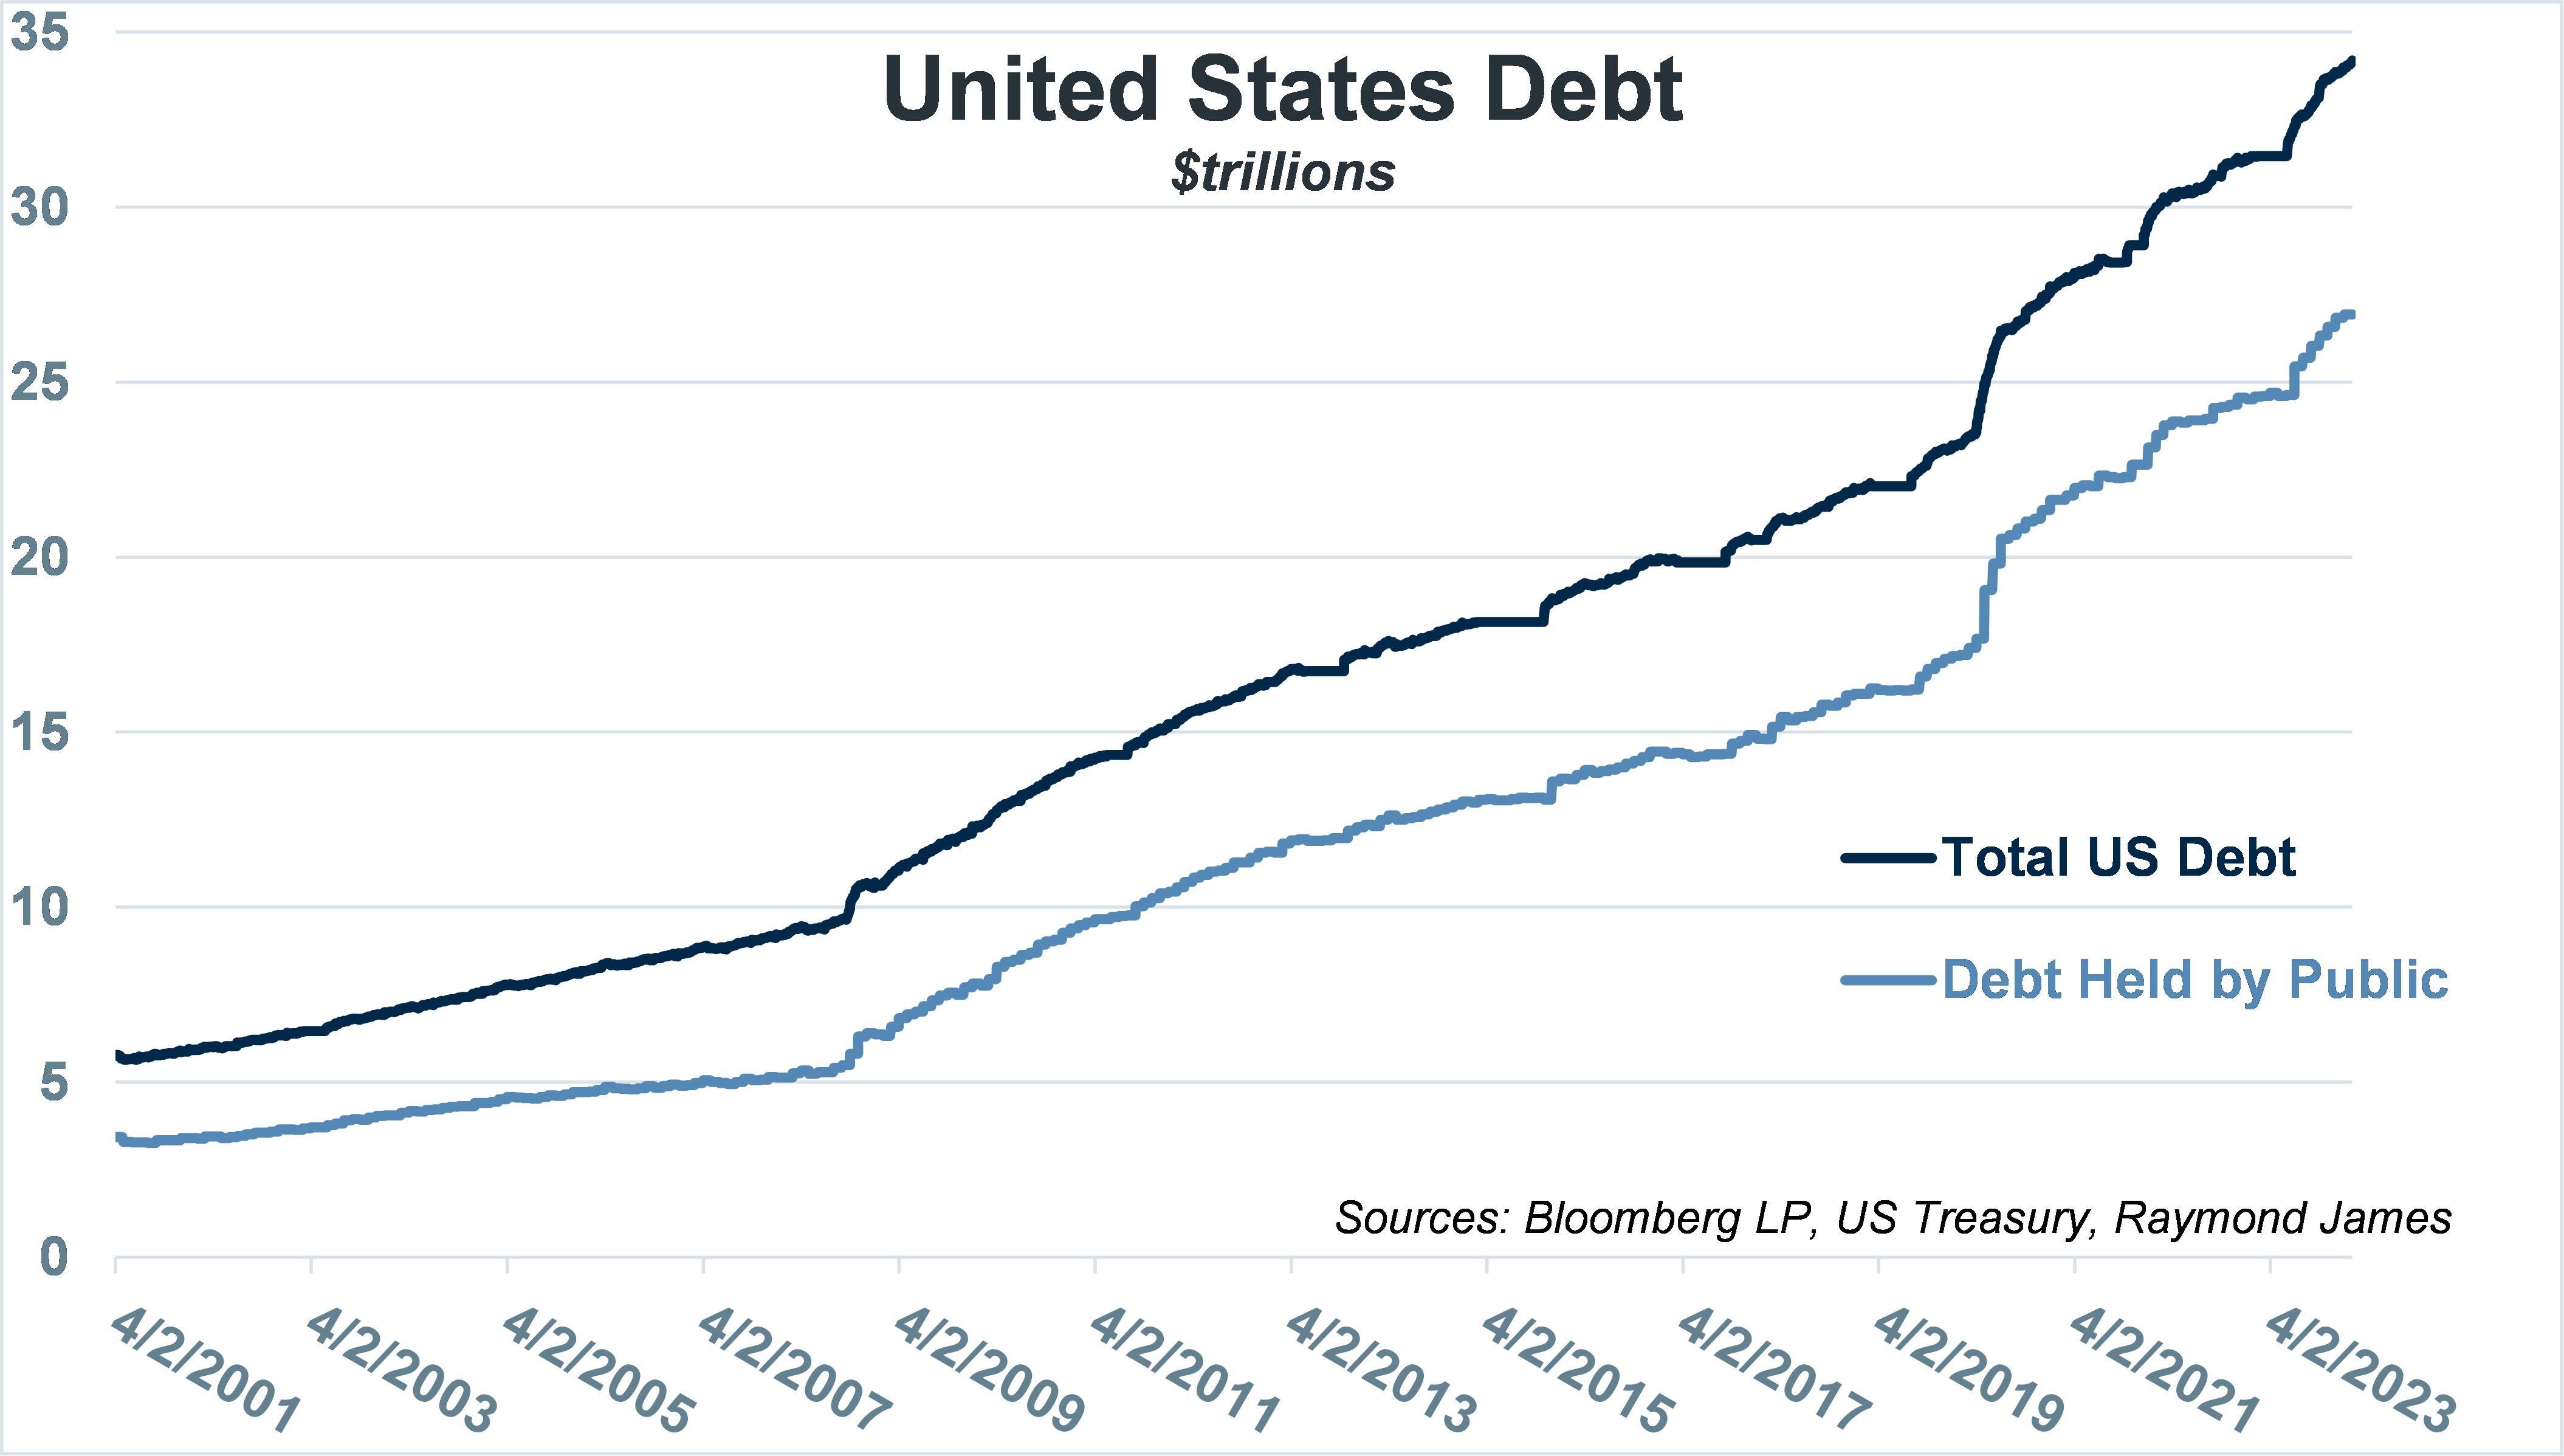
This same phenomenon is occurring with our growing national debt. The issuance on refinancing debt is more costly in this higher rate environment. In addition, financing new debt is done at a higher cost. Although the total public debt owed by our government is ~$34 trillion, if you exclude the debt one part of the government owes to another part of the government (e.g., Social Security), the federal debt held by the public is $26.9 trillion. Given our U.S. population of just under 336 million, if the debt was divided equally, each citizen would be responsible for $80,434.
While near-term, outside of the political posturing, the level of outstanding debt we have as a nation is likely not a major concern.Potential problems could arise if the issue is not addressed. The United States’ debt as a percentage of GDP is near the highest it has ever been. Total debt is currently 120% of GDP, and while it spiked to over 130% as COVID was peaking (when the economy shut down and stimulus flowed into the economy, financed by debt), the current level is very high relative to historical levels. The average from the mid-1960s to 2019, just before COVID, was ~57.5% which is less than half of the current ratio. A historical graph shows a noticeable spike just after the Great Recession, from ~60% to ~100% and then another spike during COVID, from ~100% to ~120%. Returning to the 50-60% range of the early 2000s seems like a mountainous undertaking when looking at the current state of things. The potential long-term negative effect that this could have on the economy is wide-ranging, but as debt rises, the cost of servicing this debt (interest payments) also rises meaning financial resources that could have been spent in other economic stimulating ways (infrastructure, education, defense, etc.) has to be spent on paying interest instead. Interest as a percentage of the U.S, federal budget is ~2.4%, which is the highest it has been in over 20 years and marks a sharp increase from just a few years ago (it was ~1.22% at the end of 2015).
Tackling the 800 Pound Gorilla in the Room
There are a lot of numbers to digest and an endless number of angles to view the data from. No matter how the players digest, disguise, or defer, the debt has not disappeared. As a consumer, our discretionary income is based on our income less fixed expenses. When debt goes up, we must spend less on discretionary items as bigger chunks of our revenue (paycheck) go towards that debt, or eventually we go bankrupt. Now the first argument that will ensue is that the government is “different”. And they are… to an extent. The government has something none of us do (at least legally) – the printing press. Quantitative easing has given us some history as to how the Fed uses this tool to prop up the economy. However, there can be long-term negative implications to adding money into the economy.
Consumers were provided reasons to feel wealthy as a consequence of actions and events that occurred during and after the pandemic. Lost jobs during the pandemic have been filled. The government put money directly into consumer’s bank accounts. There were deferrals on rent and student loans as well as backstops on credits and businesses. Home values experienced a robust surge. The S&P Index experienced a positive annualized total return of 28% over the last 14 months. Average earnings got a bump in 2021. In addition, discretionary spending nearly ceased during the pandemic. As the crisis subsided, consumers had bulging pockets of money and an appetite to use it. And they did.
The scale is tipping quickly to the other side as consumers have spent money as if they did have a printing press. Credit card debt is at a record high. Home values are leveling off. Government backstops are gone and deferred debt (rent, student loans, etc) is being called in. Although inflation is off its highs, it is still higher than desired. A falling inflation number does not mean prices are cheaper. It means that prices are not increasing at as fast a pace, yet they are still increasing. Also, the prices that did increase during the worst of the inflationary period are still high. If a gallon of milk went from $2.00 to $3.50, and inflation is falling, it may cost $3.52 or so under falling inflation, but not back to the $2.00 amount. So whether you believe inflation is going down or stagnating, things just cost more today. Wages have not kept pace, the cost of goods and services is up, and consumer debt has risen. This formula does not work forever.
The government debt is a growing problem too. When the country runs at a deficit, it means that expenses exceed revenues. Tax collection is the major source of revenue. Expenses include healthcare, Social Security, defense, infrastructure, etc. The U.S. typically runs at a deficit (expenses higher vs. revenue). To pay the difference, the government borrows money. The cumulative borrowing and the stimulus packages add to the nation’s debt. In theory, the government can keep printing money to cover expenses but the more money in circulation, the more inflation. The value of existing dollars is cheapened and it takes more dollars to buy the same product or service. The more dollars in print, the more interest the government owes to holders of this debt. Again, this formula does not work forever. At some point, the government would spend all its revenue on interest alone.
The government runs a surplus if it spends less than it takes in. This is politically unpopular. Does the government spend less on entitlement programs: welfare, Social Security, Medicare...? The government can raise taxes (revenue). This is also politically unpopular. Constituents typically don’t want to pay more money out of their paychecks. Printing money is inflationary. Inflation is a sort of tax. When things cost more, it can be more punishing to middle and lower classes who can less afford to have less buying power.
The government can also lower taxes. Although this cuts revenue, it puts more money in the pockets of businesses and consumers. Consumers can spend more creating demand for products and services and entice businesses to grow to meet demand.
So for now, we just keep kicking the can down the road. We like to think that politics does not interfere with what is best for our economy but the truth is that politicians want to get re-elected and a choice to cut spending or raise taxes can be counter-productive to that goal. At some point, debt becomes unsustainable. Some sacrifice must be made to avoid this catastrophe. It is a vicious circle though because no politician wants to institute a politically unpopular solution. For now, consumer debt is highly likely to curtail consumer spending which in this author’s opinion will not end in a soft landing that seems to be the latest mantra. So the economy’s first hurdle might be dealing with an economic slowdown induced by consumer behavior. This slowdown will likely invite the Fed to lower interest rates.
One last point to keep in mind in case all of this sounds very doom-and-gloom: recessions are part of a normal economic cycle. They are not something to be scared of but rather something to be prepared for. Recessions are in our future but so are periods of strong economic growth. Rather than fear what might lie around the corner, prepare for it today so that when it comes, you are ready and positioned to continue to succeed. A combination of factors such as inflation, corresponding FOMC action, stimulus, and economic growth have worked together to create a very attractive yield environment for investors. There is currently an opportunity to lock in attractive yields in high-quality assets that can help buffer the negative effects that a recession can bring to many parts of a portfolio.
Yet through all of this data and information, one thing remains in this current market. The high level of income available via fixed income is an opportunity that may eventually be gone. The government’s debt issue is a long-term problem that must be addressed before it reaches a point of no return. These long-term issues will likely be moved in various directions as economic bandaids provide temporary relief. Fixed income is a long-term strategy and the current economic condition suggests that locking into some stability may help investors weather the economic storm. There exists a twofold benefit to doing so. First, with elevated yields, investors can lock into strong income levels that will not be affected by economic turmoil assuming no default and holding investments to maturity. Second, if interest rates should decline, investors will likely be provided strong total returns as the value of fixed income held appreciates.
The can has been kicked down the road several times but it feels like the end of the road is in sight.
The author of this material is a Trader in the Fixed Income Department of Raymond James & Associates (RJA), and is not an Analyst. Any opinions expressed may differ from opinions expressed by other departments of RJA, including our Equity Research Department, and are subject to change without notice. The data and information contained herein was obtained from sources considered to be reliable, but RJA does not guarantee its accuracy and/or completeness. Neither the information nor any opinions expressed constitute a solicitation for the purchase or sale of any security referred to herein. This material may include analysis of sectors, securities and/or derivatives that RJA may have positions, long or short, held proprietarily. RJA or its affiliates may execute transactions which may not be consistent with the report’s conclusions. RJA may also have performed investment banking services for the issuers of such securities. Investors should discuss the risks inherent in bonds with their Raymond James Financial Advisor. Risks include, but are not limited to, changes in interest rates, liquidity, credit quality, volatility, and duration. Past performance is no assurance of future results.
Investment products are: not deposits, not FDIC/NCUA insured, not insured by any government agency, not bank guaranteed, subject to risk and may lose value.
To learn more about the risks and rewards of investing in fixed income, access the Financial Industry Regulatory Authority’s website at finra.org/investors/learn-to-invest/types-investments/bonds and the Municipal Securities Rulemaking Board’s (MSRB) Electronic Municipal Market Access System (EMMA) at emma.msrb.org.
