Don't Call it a Pullback

To watch/listen to this article, click here or copy and paste the following URL: https://www.youtube.com/watch?v=yfafp_-uX70
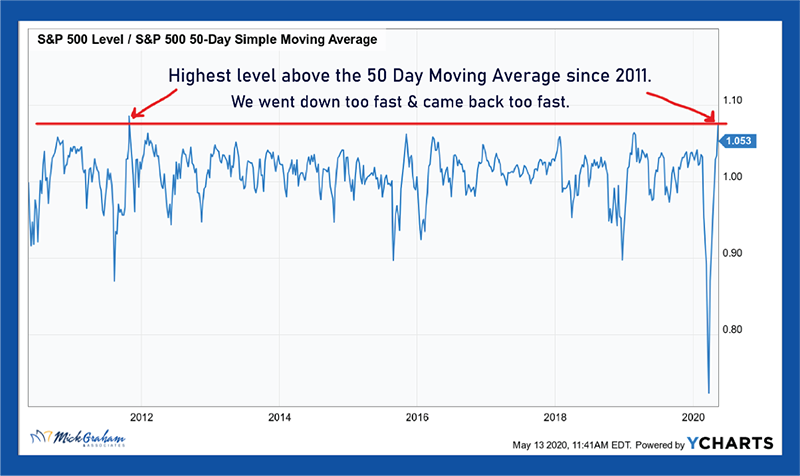
Down too fast, up too fast has been my theme for the past 15 trading days or so. Last week we saw at least 4 days of pullbacks (at the time of writing – Thursday morning). I’ve been concerned since this market rallied back so hard (34% in 35 days on the S&P 500), that there was too much of a positive outlook being put on the market in the short term. We have a lot of uncertainty and with volatility still high, and the trading algorithms ready to pounce, a pullback could be swift and severe.

Yes, we have a Fed which I feel has the ability to give the overall market a backstop. If we are taking bankruptcy out of the equation for some companies and/or industries, then surely we can be bullish? Long term yes, short term…whiplash.
Fundamentals drive long term results, headlines, emotions, greed and fear drive shorter term performance. I’ve had investment gurus who I respect, tell me to hold your clients’ hands throughout the downswings…buy and hold will eventually get you the results. But as someone who holds himself out as Certified Portfolio Manager, I know that my ability to outperform respective benchmarks on the way down exist more so than on the way up.
Therefore, I always have 3 outlooks, short, mid, and long.
Short term, driven mostly by technicals, has been concerning. After this week’s pullback, I’m waiting with anticipation to see whether some technical support levels both in the major indexes (like the S&P 500), as well as some sector indexes (like Health Care etc.), can hold their levels. If they don’t, as I show in the chart below, I expect some swift selling (mainly driven from computer trading) and that to me may be a time to get some more capital back in the market.
You’ll see from the chart below that the first levels that I’m looking towards is upside of 2900 (which we broke through a couple of times in the past two weeks), and 2737 on the downside. If the market moves either side of these levels in the short term, it gets my looking at either trimming or adding. I have secondary levels on both sides, but I won’t bore you with all of those details until we need to look at them.

Intermediate (which I classify as 3-9 months), has me believing that without some “confirmed” vaccine or cure that we are at levels that are justified, (even within the tight range shown above). The path however will not be flat. Volatility I expect will remain high through this period, as headlines flow through, mostly exacerbated by talking heads looking to get eyeballs.
Yes, there are strategies that are open to us in sideways markets, however, to go into those strategies I’ll need to speak with you one on one. More broadly though, I think once major index levels get above support and resistance, a closer look at individual names will supply intermediate term opportunities.

Longer term, the news is better. I now get to use my “go to” visuals on investing, plus a couple of new data points.
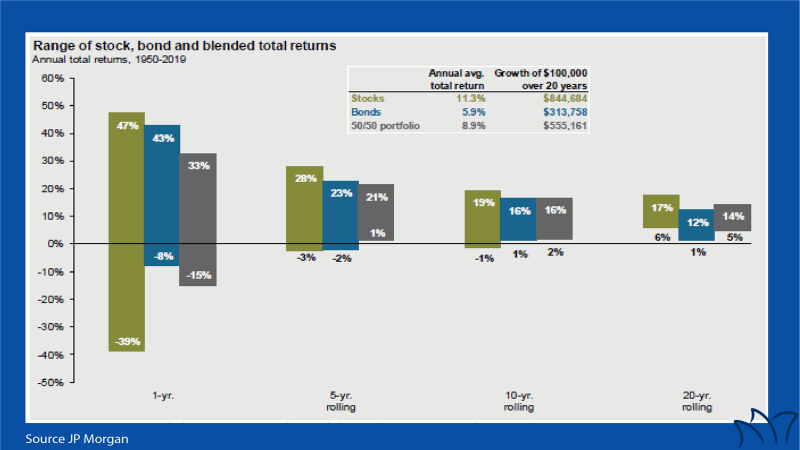
First, I will tell you that when investing for the long term, market timing doesn’t have the effect on returns that you would think it would. 20 year returns on the S&P range between 6% and 17% dating back to 1950, meaning if you picked the worst 20 year period to start investing out of the last 70 years, you still obtained an average return of 6% annually.
Further reinforced by our normalized earnings compound chart…There is nothing out of what I see damaging the market in the short term that will kill capitalism or make believe less that there is innovation in the economy today that will drive growth tomorrow.

When the data gets bad, subsequent longer term results are good. Worst decile jobs numbers average the best next 12 months returns.

When the bears are growling, we tend to get the best returns over the next 12 months, or at least above average returns. See the charts below which I will break down a little further on the video.


So, in general, last week’s pull back has actually made me a little more comfortable. It’s hard to make sense of the markets continuing to rise without longer term fundamentals.
With that said, here’s the buy/sell.

Opinions expressed in the attached article are those of the author and are not necessarily those of Raymond James. All opinions are as of this date and are subject to change without notice. Diversification and asset allocation do not ensure a profit or protect against a loss. The S&P 500 is an unmanaged index of 500 widely held stocks that is generally considered representative of the U.S. stock market. Keep in mind that individuals cannot invest directly in any index, and index performance does not include transaction costs or other fees, which will affect actual investment performance. Individual investor's results will vary. Past performance does not guarantee future results.
