
Market chaos is harvesting income opportunities
Doug Drabik discusses fixed income market conditions and offers insight for bond investors.
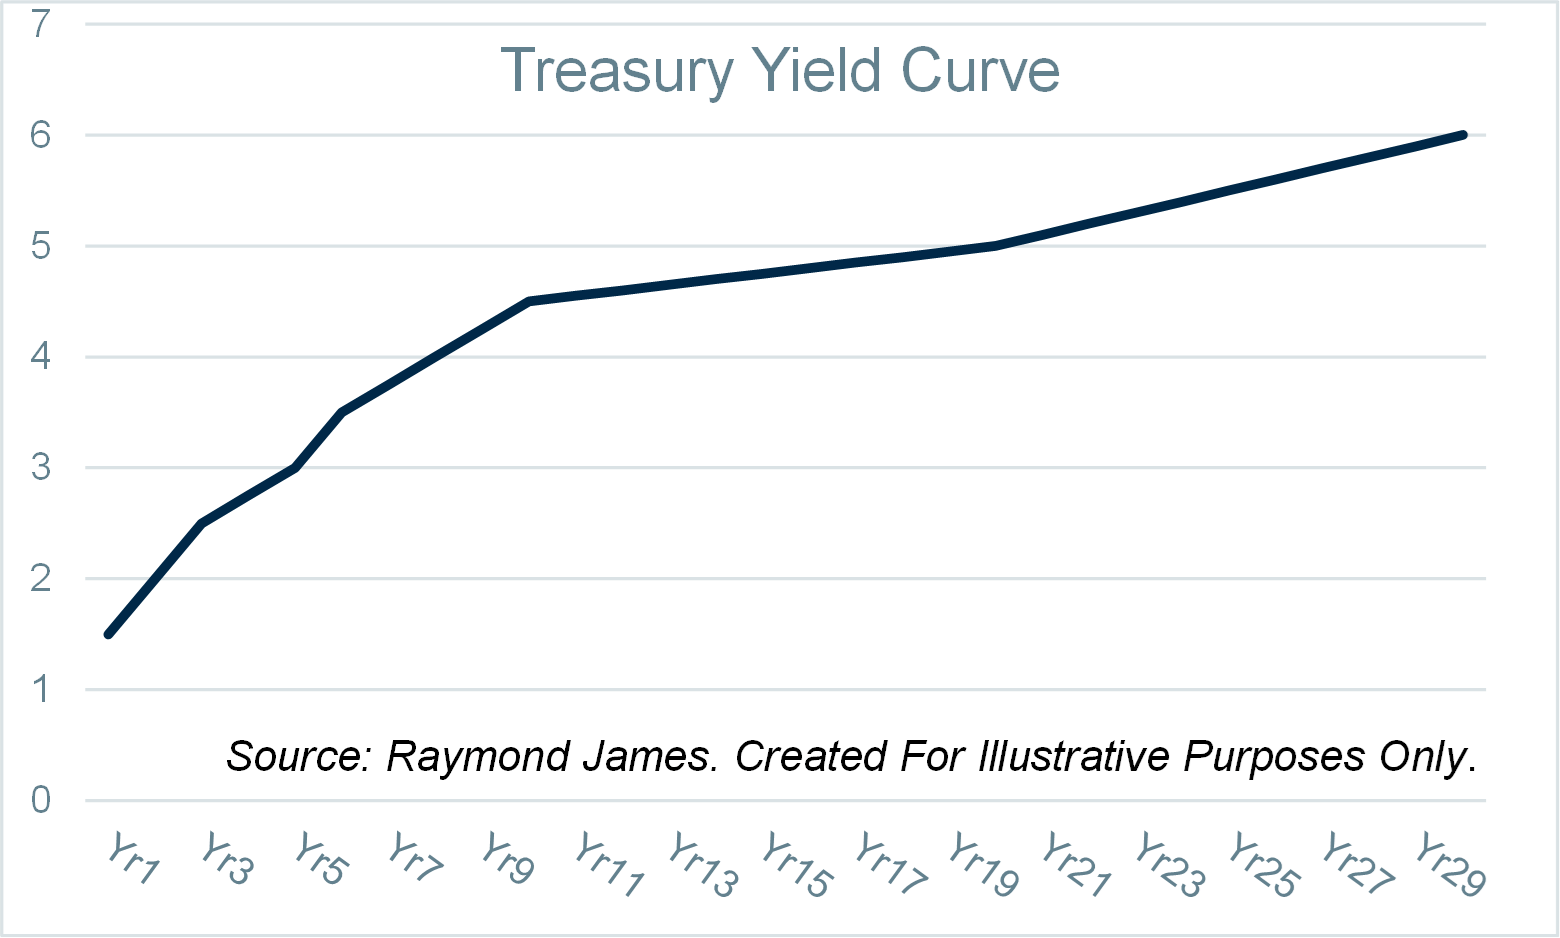
If we could imagine a “normal” yield curve, what might it look like? Intuitively, the more duration risk taken, the more reward or yield demanded by investors. This is why, historically, the yield curve provides incrementally more yield for longer-maturity bonds. It may be called an upward sloping curve and look like this graph.
Geopolitical events, government and central bank policies, black swan events (like COVID), inflationary expectations, consumer sentiment, and domestic disturbances are among the collection of occurrences that can change the shape of the Treasury curve. Most recently, the Treasury curve was inverted (short-term rates were higher than long-term rates) for what proved to be an exceptionally long time (over two years). Curves can invert when consumers think the economy is slowing down and believe that the Federal Reserve may lower interest rates to stimulate growth.
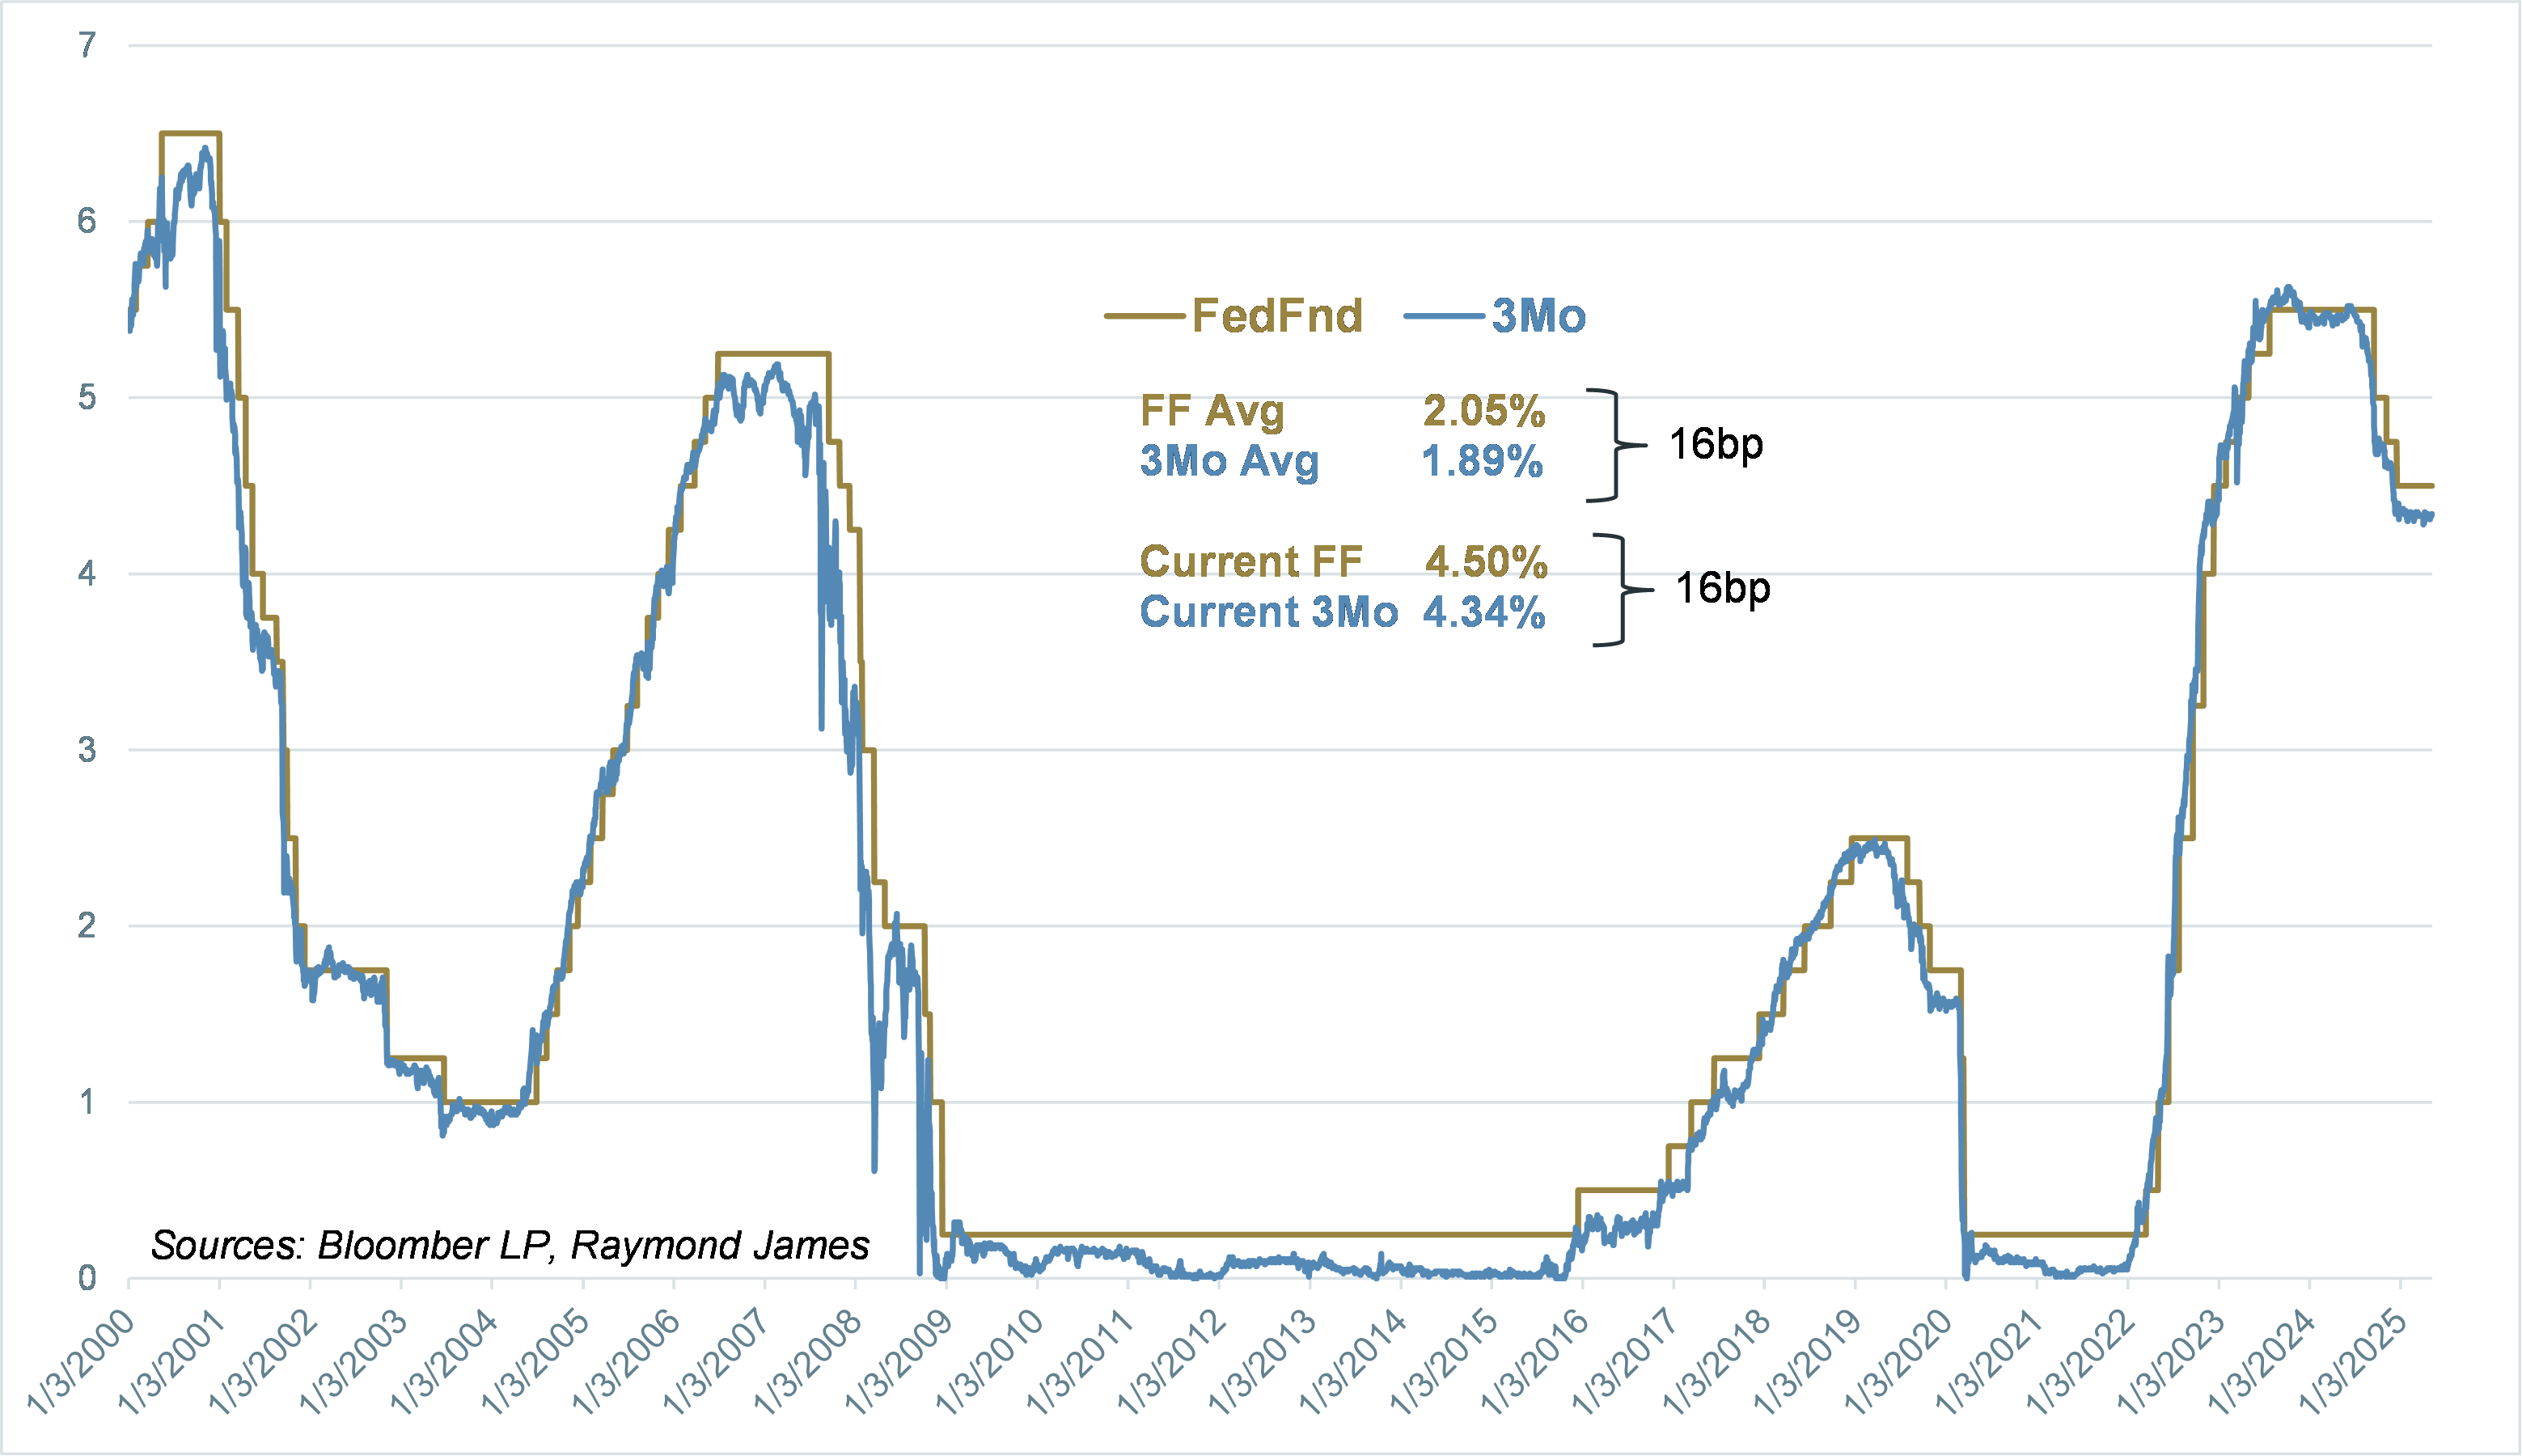
The US central bank (the Federal Reserve) dictates monetary policy. That is, they control short-term interest rates by dictating the rate on Federal Funds. Raising and lowering the federal funds rate can stimulate or dampen economic activity, making it easier or harder for businesses to borrow funds and capitalize on business activity. When you examine the comparison between Fed Funds and the 3-month Treasury Bill, it is obvious that they are highly correlated. This is why you might hear that the Fed controls interest rates. In reality, they are controlling short-term interest rates. For the past 25 years, the average difference between Fed Funds (upper bound) and the 3-month Treasury Bill has been 16 basis points. Not surprisingly, the current difference between them has been around 10 to 18 basis points.
When we move out on the curve, things do not add up so cleanly, historically speaking. This last graph compares the relationship between the 3-month and 10-year Treasury. In the previous 25 years, the average spread between the two has been 140 basis points. Currently, the 10-year Treasury is seven basis points higher versus the 3-month T-Bill.
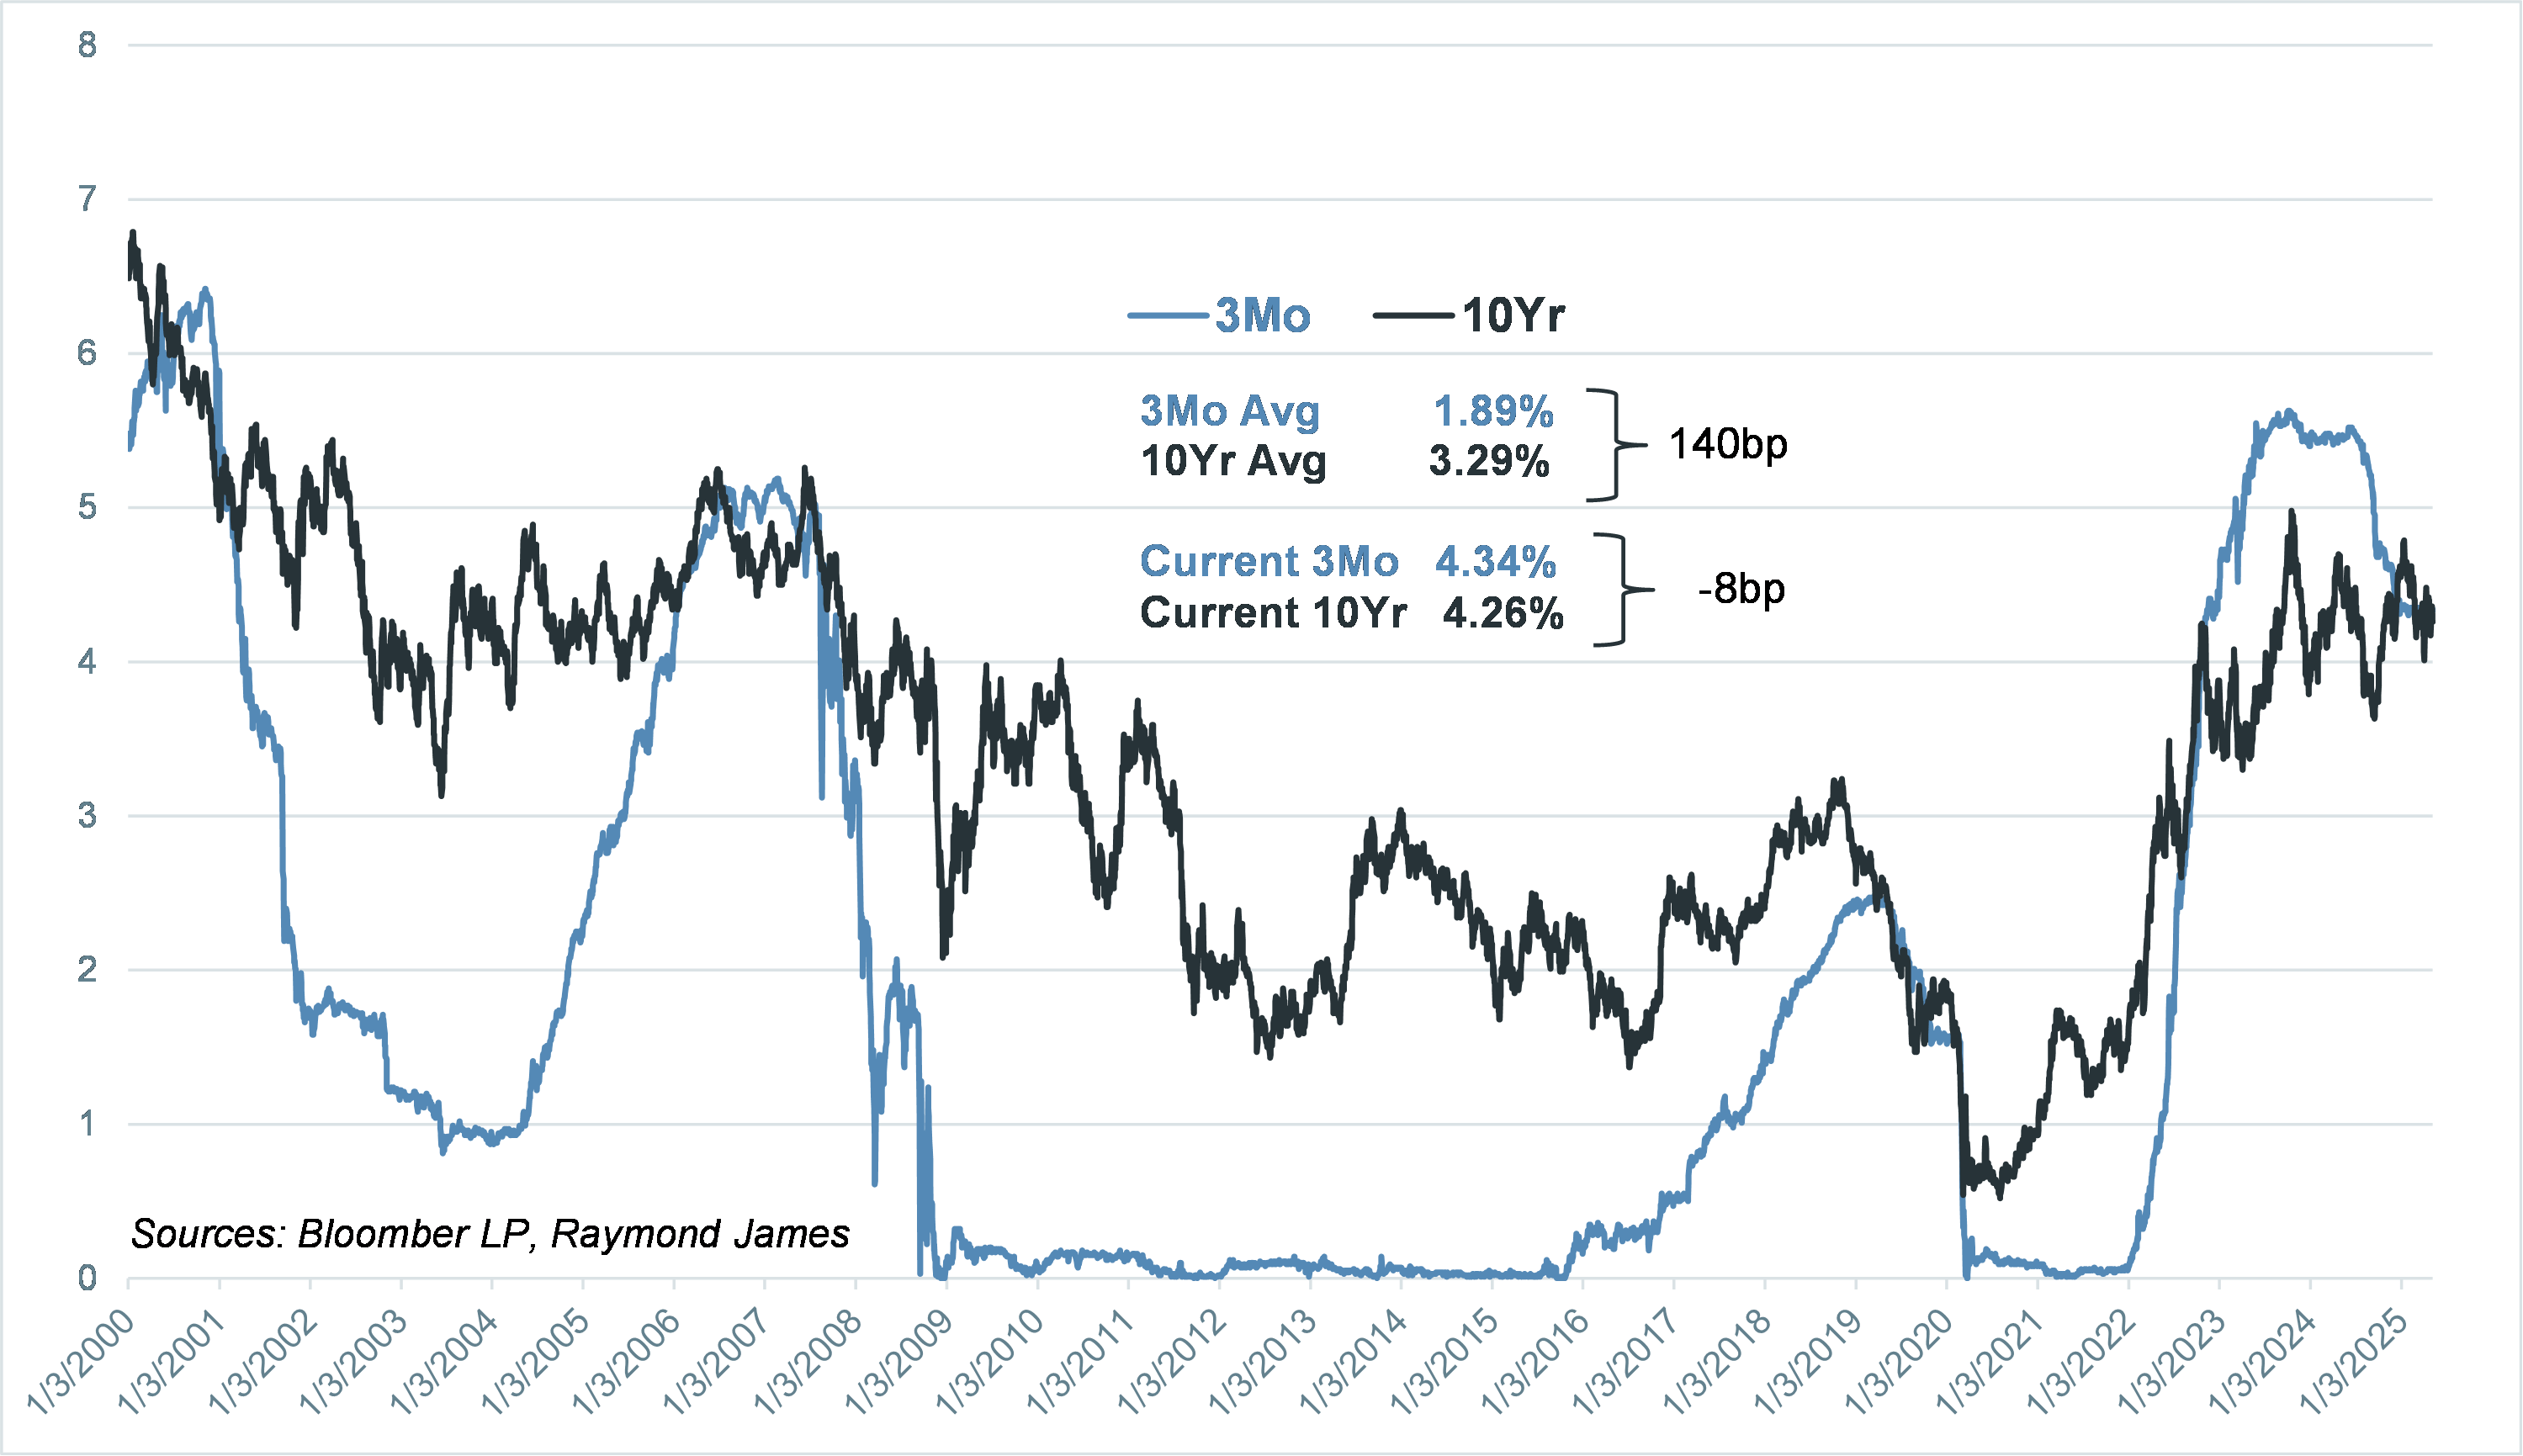
There are several takeaways. Instinctively, the Federal Reserve does not have the same influence on the longer end of the Treasury curve as they do with short-term interest rates. So why is the intermediate to long part of the curve not historically “in line?” The reason(s) may help to explain the financial markets' volatility as well as the Federal Reserve's dilemma. No one has a clear picture of the direction of the economy or the direction of interest rates. There is compelling evidence to suggest the economy may slow down. If this is the case, why isn’t the Fed lowering short-term interest rates to keep the economy stimulated? One reason is that economic data has shown resilience as consumers remain engaged and employment stays near optimal levels.
On the other hand, inflation remains sticky and trials like higher tariffs threaten an increase in pricing, thus fueling inflation fears. This could force the Fed to keep interest rates as is or even consider raising rates. The dilemma is real, and there are plenty of bright financial minds on either side of the debate. What comes out is a relatively odd-shaped curve and considerable market volatility.
There is so much the market does not know, yet there is one thing we do know. Treasury yields are elevated, which means many product curves are also elevated. For example, the corporate and municipal curves are not only elevated in yield, but they are also upward sloping. They provide investors with incrementally more yield when taking on longer maturities or more interest rate risk. At the same time, investors are still leery of future interest rate direction and benefit from the sticky high rates afforded on the short end of the curve.
Fixed income strategies are abundant and appealing for a myriad of investor types. The Fixed Income Quarterly will be released next week and will address several fixed income opportunities in greater detail. The most important takeaway is that income opportunities have been created by the financial market indecisiveness, unusual yield curve behavior, and generally high interest rates. Talk with your financial advisor about the income opportunities that match your specific investment goals.
The author of this material is a Trader in the Fixed Income Department of Raymond James & Associates (RJA), and is not an Analyst. Any opinions expressed may differ from opinions expressed by other departments of RJA, including our Equity Research Department, and are subject to change without notice. The data and information contained herein was obtained from sources considered to be reliable, but RJA does not guarantee its accuracy and/or completeness. Neither the information nor any opinions expressed constitute a solicitation for the purchase or sale of any security referred to herein. This material may include analysis of sectors, securities and/or derivatives that RJA may have positions, long or short, held proprietarily. RJA or its affiliates may execute transactions which may not be consistent with the report’s conclusions. RJA may also have performed investment banking services for the issuers of such securities. Investors should discuss the risks inherent in bonds with their Raymond James Financial Advisor. Risks include, but are not limited to, changes in interest rates, liquidity, credit quality, volatility, and duration. Past performance is no assurance of future results.
Investment products are: not deposits, not FDIC/NCUA insured, not insured by any government agency, not bank guaranteed, subject to risk and may lose value.
To learn more about the risks and rewards of investing in fixed income, access the Financial Industry Regulatory Authority’s website at finra.org/investors/learn-to-invest/types-investments/bonds and the Municipal Securities Rulemaking Board’s (MSRB) Electronic Municipal Market Access System (EMMA) at emma.msrb.org.
