

“There is a great disturbance in the Force.” – Emperor Palpatine
In recent years, many managers inside and outside the U.S. have been aligned in their belief that U.S. stocks, especially U.S. large cap growth stocks were destined to continue outperforming other stock market segments in and outside the U.S. market. Not only did they believe this was the most fertile ground for recent returns, but that it was the place to be for realizing superior future returns. Managers of all stripes including European pension managers and others piled into the same stocks. At some point, it is reasonable to believe that this would become an overly ‘crowded trade.’ Predicting when and where these inflection points lie is inherently difficult. Momentum is often the name of the game until it isn’t. We find it is helpful to monitor valuation metrics and investor sentiment and ask the following questions –
- What could possibly cause these ‘in favor’ market segments and stocks to falter in the years ahead? and,
- What could enable these underperforming market segments to defy expectations and surprise on the upside?
As I shared, noteworthy investors have said things that instill confidence in our approach. For instance, Warren Buffet said before the peak in the 2000 tech bubble, “You pay a lot for a cheery consensus.” As I shared in my letter on January, 6, 2025, Stanley Druckenmiller said, “I have found it’s very important to never invest in the present. Always try to envision the situation as you see it in 18 to 24 months.”
As you may know, I listen to lots of investment related podcasts when I am on long walks or bike rides. Quite a few introduce me to investors that see things very differently. I find it interesting to hear their insights and perspectives – including when they differ from our own or the consensus. Of late, several have been discussing why we are seeing increased flows into market segments like developed markets outside of the U.S. Some firms that follow investment flows data are also seeing these investments are being funded by reductions in allocations in U.S. large caps and ‘growth’ stocks in particular. One recent monthly survey (e.g. the Bank of America Global Fund Manager Survey) indicates that investment managers believe international stocks will likely provide better returns that US stocks over the next 5 years. Please see the chart below –
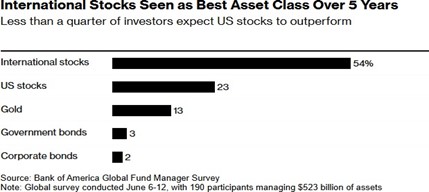
We don’t know if these expectations will prove to be on target. Lots of unexpected developments in the economy, markets and politics could change not only the outlook but actual market results. That said, if international markets do continue to outpace returns for things like the S&P 500, it would not surprise us to see increased investment flows into non-U.S. stocks by institutions and individuals alike. That could translate into a change a leadership that could in turn enable a sustained period of outperformance by international markets. Afterall, good performance often attracts more flows that serve as a self- reinforcing phenomenon. What we do know is lots of investors allocate into segments that are performing well and out of those where headlines and price action are concerning. Price and valuation metrics can travel far from historical norms and when trends appear to be enduring investors tend to ignore inputs like valuation and ‘go with the flow.’ Because we can’t predict when investor preferences and/or catalysts may or may not happen, we diversify!i
Below, I have included two recently updated market segment forecasts from reputable firms. The first is GMO’s 7-year forecast and the second is Vanguard’s 10-year estimated return forecast. If they are directionally correct, investors will be well served to own broadly diversified portfolios (and appreciably lower U.S. large cap allocations).
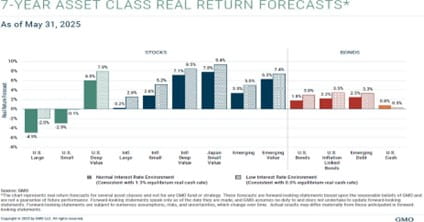
Source: GMO as of May 31, 2025
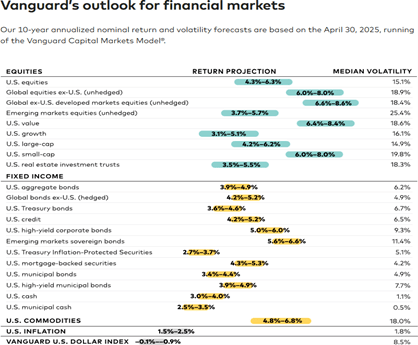
Source: Vanguard
In conclusion, we don’t know the sequence or magnitude of future bear and bull markets. Nevertheless, we believe changes in leadership often occur when investors collectively least expect them. One thing that we glean from these and the many other intermediate and longer-term forecasts is an expectation for appreciably lower prospective returns for U.S. large cap and large cap growth in particular than we have experienced since the March 2009 lows. We believe that makes sense and want to make sure you have perspective on these lower prospective return outlooks.
As always, we very much appreciate the confidence you have entrusted in our team. We welcome your questions and perspective. We are committed to your financial well-being.
W. Richard Jones, CFA
Partner, Harmony Wealth Partners
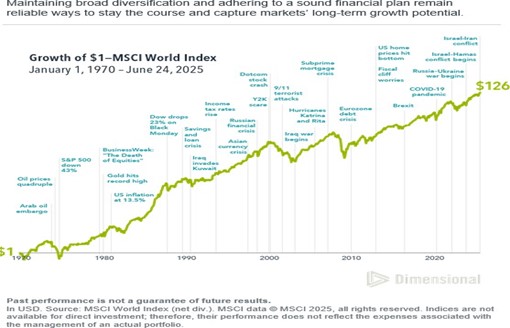
i I had finished writing this letter, when the chart below arrived in my inbox. I thought it made sense to share it and add some observations.
“The most important quality for an investor is temperament, not intellect.” – Warren Buffett
When I look at the chart above, I see several things, namely -
- Long-term success. Over long periods of time, we experience real economic growth that translates into long-term growth in revenue and This plus inflation is reflected in long-term and provides similar stock price gains.
- Lots of volatility along the way, and importantly,
- There are extended periods where the price/total returns are flat and Inopportune purchases and subsequent sales translated into realized losses for scores of investors during periods within this 55-year span. On the other hand, purchases made when prices proved to be unsustainably too low (e.g. the particular security establishes and enduring secular bear market low), have provided opportunities for significant gains.
What we don't see is investors actual 'realized' experience. Unfortunately, many people (pros and individuals alike) invest heavily near tops and/or largely sell out of stocks near market bottoms. Investors who buy into markets and market segments near highs or get out of and stay out of stocks near market bottoms do not realize the favorable results shown in the chart above. On the other hand, adding to stock positions during duress and rebalancing within reasonable bands along the way can foster even better outcomes. Rebalancing in conjunction with thoughtful incorporation of valuation metrics and investor sentiment can enable investors to have confidence when the chips are down and tempered expectations when all appears well, but actually isn’t. Fear and greed are powerful emotions that often lead investors to make detrimental decisions.
Any opinions are those of the author, are subject to change without notice and are not necessarily those of Raymond James. This material is being provided for information purposes only and does not purport to be a complete description of the securities, markets, or developments referred to in this material and does not constitute a recommendation. The information has been obtained from sources considered to be reliable, but we do not guarantee that the foregoing material is accurate or complete. There is no guarantee that these statements, opinions or forecasts provided herein will prove to be correct. Past performance may not be indicative of future results. Future investment performance cannot be guaranteed, investment yields will fluctuate with market conditions. Investing involves risk and investors may incur a profit or a loss regardless of strategy selected, including asset allocation and diversification. The S&P 500 is an unmanaged index of 500 widely held stocks that is generally considered representative of the U.S. stock market. International investing involves special risks, including currency fluctuations, differing financial accounting standards, and possible political and economic volatility. Investing in emerging markets can be riskier than investing in well-established foreign markets. Raymond James is not affiliated with any of the aforementioned individuals or organizations.
