Patience Grasshopper
February 16, 2024
“You get recessions, you have stock market declines. If you don’t understand that’s going to happen, then you are not ready, you won’t do well in markets.” – Peter Lynch
Most investors know Wall Street is a two-way street, but many investors are caught off guard when markets reverse course. That’s because when all the news is seemingly good, markets can fall significantly and when headwinds appear obvious, markets can turn up appreciably. Another legendary investor, Sir John Templeton said, “Bull markets are born on pessimism, grow on skepticism, mature on optimism and die of euphoria.” Of course, it is nearly impossible to forecast inflection points. Nevertheless, we believe investors are wise to ‘take the market’s temperature.’ By that we mean it makes sense to measure things like valuation metrics, investor sentiment, investment flows and other data that can help assess whether investors are pessimistic, highly optimistic or more commonly well inside those extremes. Economies and markets exhibit cycles and making judgments along the way can aid decision making and instill patience when many investors are prone to make abrupt changes. Economic downturns are inevitable, but as Peter Lynch also noted - “We have had 13 recessions since WW II and we have had 13 recoveries.”
Staying the course is often the best thing to do. Even when it feels uncomfortable.
Investors are often caught offsides. When Covid arrived unexpectedly, the markets fell precipitously. Many investors feared that significant downside was way more likely than a recovery in prices and sold equities. Lo and behold, the markets turned around and closed at all-time highs that year. The U.S market rose significantly more through 2021. Seeing a new phase, investors added to stocks (well off the 2020 lows) and lo and behold, 2022 was one of the worst years in memory for stocks and bonds. Tired of getting hammered in late 2022, many investors sought refuge on the sidelines. They missed much of the gains we have experienced since. As I have shared numerous times, our approach is centered upon adopting and then largely maintaining long-term strategic allocations that make sense for each of your preferences, needs and circumstances.
Investors who invest for the long-term experience the painful downs, but their patience has generally been rewarded as stock indexes tend to move substantially higher over the long term. That’s because long-term growth in the economy and corporate profits tend to be significant and that powers stock prices higher. All stocks? No! Many stocks including those that had been rewarding for many years falter and effectively never regain their mojo. However, collectively winners overwhelm losers - a $10 stock can go to zero or $100. In the aggregate, winners drive returns higher. That’s why we invest in market segments not the individual stocks that may or may not continue to reward investors.
When companies, industries and market segments are executing well, that often (but not always) shows up in favorable price gains. The reason why I say ‘not always’ is because expectations and valuations can eventually become too high so even good EPS reports can fail to lift stocks higher. The opposite is also true. When expectations are palpably low, it often doesn’t take much for surprisingly positive responses (price gains) to happen. This is one of the reasons we are comfortable maintaining ownership in market segments that have been lackluster. At some point, there is absence of positive expectations and valuation multiples reflect that. Then, if companies do show improvement, stock gains can be surprisingly good for longer than most investors imagine. That’s because low expectations are embedded in stocks at what prove to be market bottoms.
“Be fearful when others are greedy and greedy when others are fearful.” – Warren Buffett
We don’t have a separate allocation to Chinese equities, but China’s share of the Emerging Market (EM) indexes is significant (e.g., about 22% to 28% de[ending upon the EM index). As you may know, Chinese stock indexes have been performing poorly. We wanted to share some perspective and our rationale for maintaining positions in EM. As succinctly as possible the reasons are –
- These markets perform very differently over time than things like the S&P
- They have performed poorly for a long
- Seemingly no one likes them (pessimism is high, favorable sentiment is hard to find).
- They seem to be attractively priced (e.g., absolute and relative valuation metrics are low).
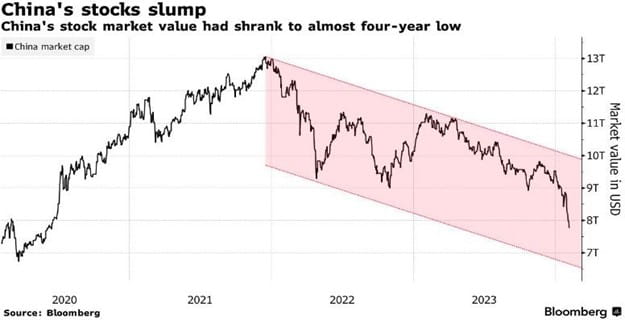
As you can see, the aggregate market value of the Chinese equity markets is slightly less than $8 trillion. The aggregate value of the S&P 500 as of February 13, 2023 exceeded $41 trillion. On that same day, the value of the S&P’s top 10 components is $14 trillion and the top 5 (MSFT, AAPL, NVDA, AMZN and GOOG) was $11.5 trillion. While the markets are clearly different, China is often referred to as ‘the factory for the world’ and has a population of roughly 1.4 billion and is the world’s second largest economy.
Chinese retail investors are very important participants in China’s equity markets. Chinese investors have been significantly reducing ownership of Chinese traded stocks and adding aggressively to U.S. and Japanese stocks. It could be that they are seeing and appreciating things that we are not aware of, and they have an informed view. On the other hand, it could be that Chinese investors like many of their U.S. counterparts also have a propensity to sell heavily after significant declines and buy aggressively after large runups in prices (and valuations). i
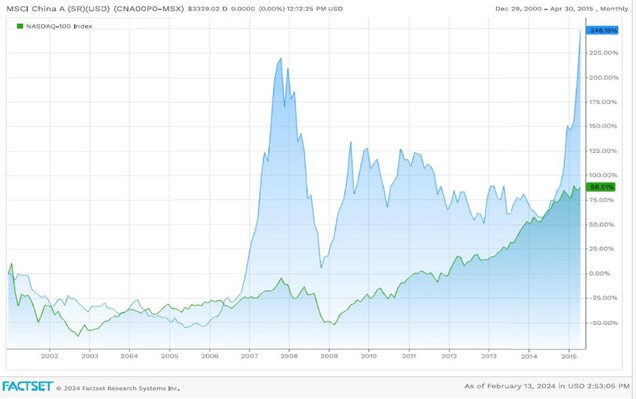
The charts on the next page show the performance of the NASDAQ 100 index compared to the MSCI China index across two time periods.ii The first of the two shows, the MSCI China index significantly outpaced the return for the NASDAQ 100 in most (not all) periods from December 29, 2000 thru April 30, 2015. We note that from March 31, 2000, it took the S&P 500 14 years and the NASDAQ 100 13 years, respectively to make and hold new highs.
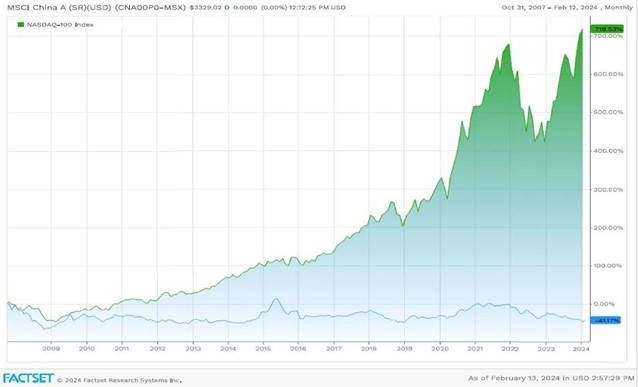
As the chart below shows, the NASDAQ has performed exceptionally well (despite declining significantly during the GFC bear market – Oct 2007 – March 2009) since October 31, 2007. Conversely, the MSCI China index has declined 41% over this same time period. These market segments performed very differently over time. The question is might the Chinese market surprise on the upside in the years ahead?
sense to allocate into and then maintain ownership of all major market segments that tend to perform differently over time. Doing so can help ensure we are never concentrated in the wrong place at the wrong time and that we have meaningful allocations in whatever segments perform best in the years and decades ahead. The equity market pendulum swings quite far at times and when it does, it causes many investors to make changes that can be detrimental. While we are constantly seeking advice from our service partners at the major investment firms (including Raymond James), reading copious research and cogitating on opportunities to add investments that might further aid diversification and/or your long-term well- being, we largely hue to the wisdom of the Founder and CEO of the Vanguard Group Jack Bogle who said - “Don’t do something, just stand there.”
Warmest regards and please share your thoughts and questions!
W. Richard Jones, CFA
Partner, Harmony Wealth Partners
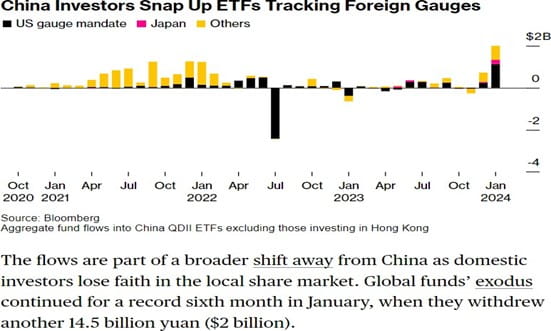
I would only note that it appears that Chinese investors sold U.S. positions heavily near the 2022 bottom and have only recently made significant acquisitions to U.S. equities recently. Their timing doesn’t appear prescient.

From yearend 2008 through the 4th quarter of 2017, the MSCI China index outpaced the MSCI ACWI (all country world index). It along with the MSCI Emerging Market have lost significant value while the U.S. has fared very well and driven the lion’s share of gains for the MSCI ACWI. Valuation metrics for China and EM more broadly are low. Returns over the past 10+ years have been anemic – as was the case for U.S. indexes from the early 2000 highs. Indeed since 1992, the table above reveals that the returns for the MSCI China index have been approximately 0% since 1992. Extended periods of lackluster performance often precede extended periods of significant reward.
Source: MSCI.com
Every investor's situation is unique and you should consider your investment goals, risk tolerance and time horizon before making any investment. Prior to making an investment decision, please consult with your financial advisor about your individual situation. Investing involves risk and you may incur a profit or loss regardless of strategy selected. Past performance is not a guarantee of future results. Keep in mind that individuals cannot invest directly in any index, and index performance does not include transaction costs or other fees, which will affect actual investment performance. Individual investor's results will vary. The S&P 500 is an unmanaged index of 500 widely held stocks that is generally considered representative of the U.S. stock market. The NASDAQ composite is an unmanaged index of securities traded on the NASDAQ system. MSCI China Index measures the performance of large cap Chinese equities. The MSCI Emerging Markets is designed to measure equity market performance in 25 emerging market indices. The index’s three largest industries are materials, energy, and banks. The MSCI ACWI (All Country World Index) is a free float-adjusted market capitalization weighted index that is designed to measure the equity market performance of developed and emerging markets. As of June 2007 the MSCI ACWI consisted of 48 country indices comprising 23 developed and 25 emerging market country indices. The developed market country indices included are: Australia, Austria, Belgium, Canada, Denmark, Finland, France, Germany, Greece, Hong Kong, Ireland, Italy, Japan, Netherlands, New Zealand, Norway, Portugal, Singapore, Spain, Sweden, Switzerland, the United Kingdom and the United States. The emerging market country indices included are: Argentina, Brazil, Chile, China, Colombia, Czech Republic, Egypt, Hungary, India, Indonesia, Israel, Jordan, Korea, Malaysia, Mexico, Morocco, Pakistan, Peru, Philippines, Poland, Russia, South Africa, Taiwan, Thailand, and Turkey. The foregoing information has been obtained from sources considered to be reliable, but we do not guarantee that it is accurate or complete, it is not a statement of all available data necessary for making an investment decision, and it does not constitute a recommendation. Any opinions are those of W. Richard Jones and not necessarily those of Raymond James. Securities offered through Raymond James Financial Services, Inc., Member FINRA/SIPC. Investment advisory services offered through Raymond James Financial Services Advisors, Inc. Harmony Wealth Partners is not a registered broker/dealer and is independent of Raymond James Financial Services.
