Patience is the key to successful investing
October 16, 2024
“Patience is the key to successful investing. It’s essential to have a long-term perspective and enough discipline to avoid impulsive decisions. Otherwise, it’s very easy to simply follow the crowd.” - Warren Buffett
I have a long-held conviction that the best way to achieve success is to acknowledge that the direction of the capital markets over the short to intermediate term is largely unknowable. Fortunately, it is also of far less significance than the impact of compounding capital over the long term. Investing is akin to running a marathon, not a series of short-term sprints. The proverbial tortoise really can beat the hare. The process may not be as exciting or fun in ‘the best of times,’ but it is enduring and sensible. Diversification (like all other approaches) doesn’t work particularly well all the time, but it does tend to foster favorable outcomes over time. The same is generally not true for highly concentrated portfolios.
It is not unusual to see some segments outperforming others by very large margins. When the leaders are large, well-known companies, it is easy for investors to develop high conviction that the winners will continue to keep rewarding investors and that laggards are simply a drag on performance. Indeed, at what prove to be late in a favorable bull phase, some investors seem to believe we are just getting started. That said, it is important to recognize that the current winners were likely less well thought of at the start of the current period of outperformance. Indeed, most powerful bull phases start from periods where confidence and valuation metrics like the PE ratio were low.
Markets are cyclical. Pleasing phases are often characterized by favorable growth in sales, earnings and rising valuation. It is also helpful to recognize that the increasing valuation tailwind can easily become a headwind if the PE contracts. Down periods and periods of stagnation typically occur when growth in fundamentals are poor/lackluster and valuation metrics are contracting. While timing inflection points is inherently difficult, incorporation of valuation metrics into one’s purchase and sale decisions can go a long way toward decreasing the adverse impacts of getting caught offsides when significant leadership changes occur.
To aid decision making, we find it helpful to adopt a long-term ownership mentality and to consciously and deliberately marry up securities that have merit in their own right, but that will likely perform differently over time. Doing so can help us maintain broad diversification when many other investors are prone to making significant changes in their quest to own more of the winners and less of the losers. If only that was an easy process. Sadly, it is not. This is repeatedly shown in the relevant data over time. Let’s take a look on the next page.
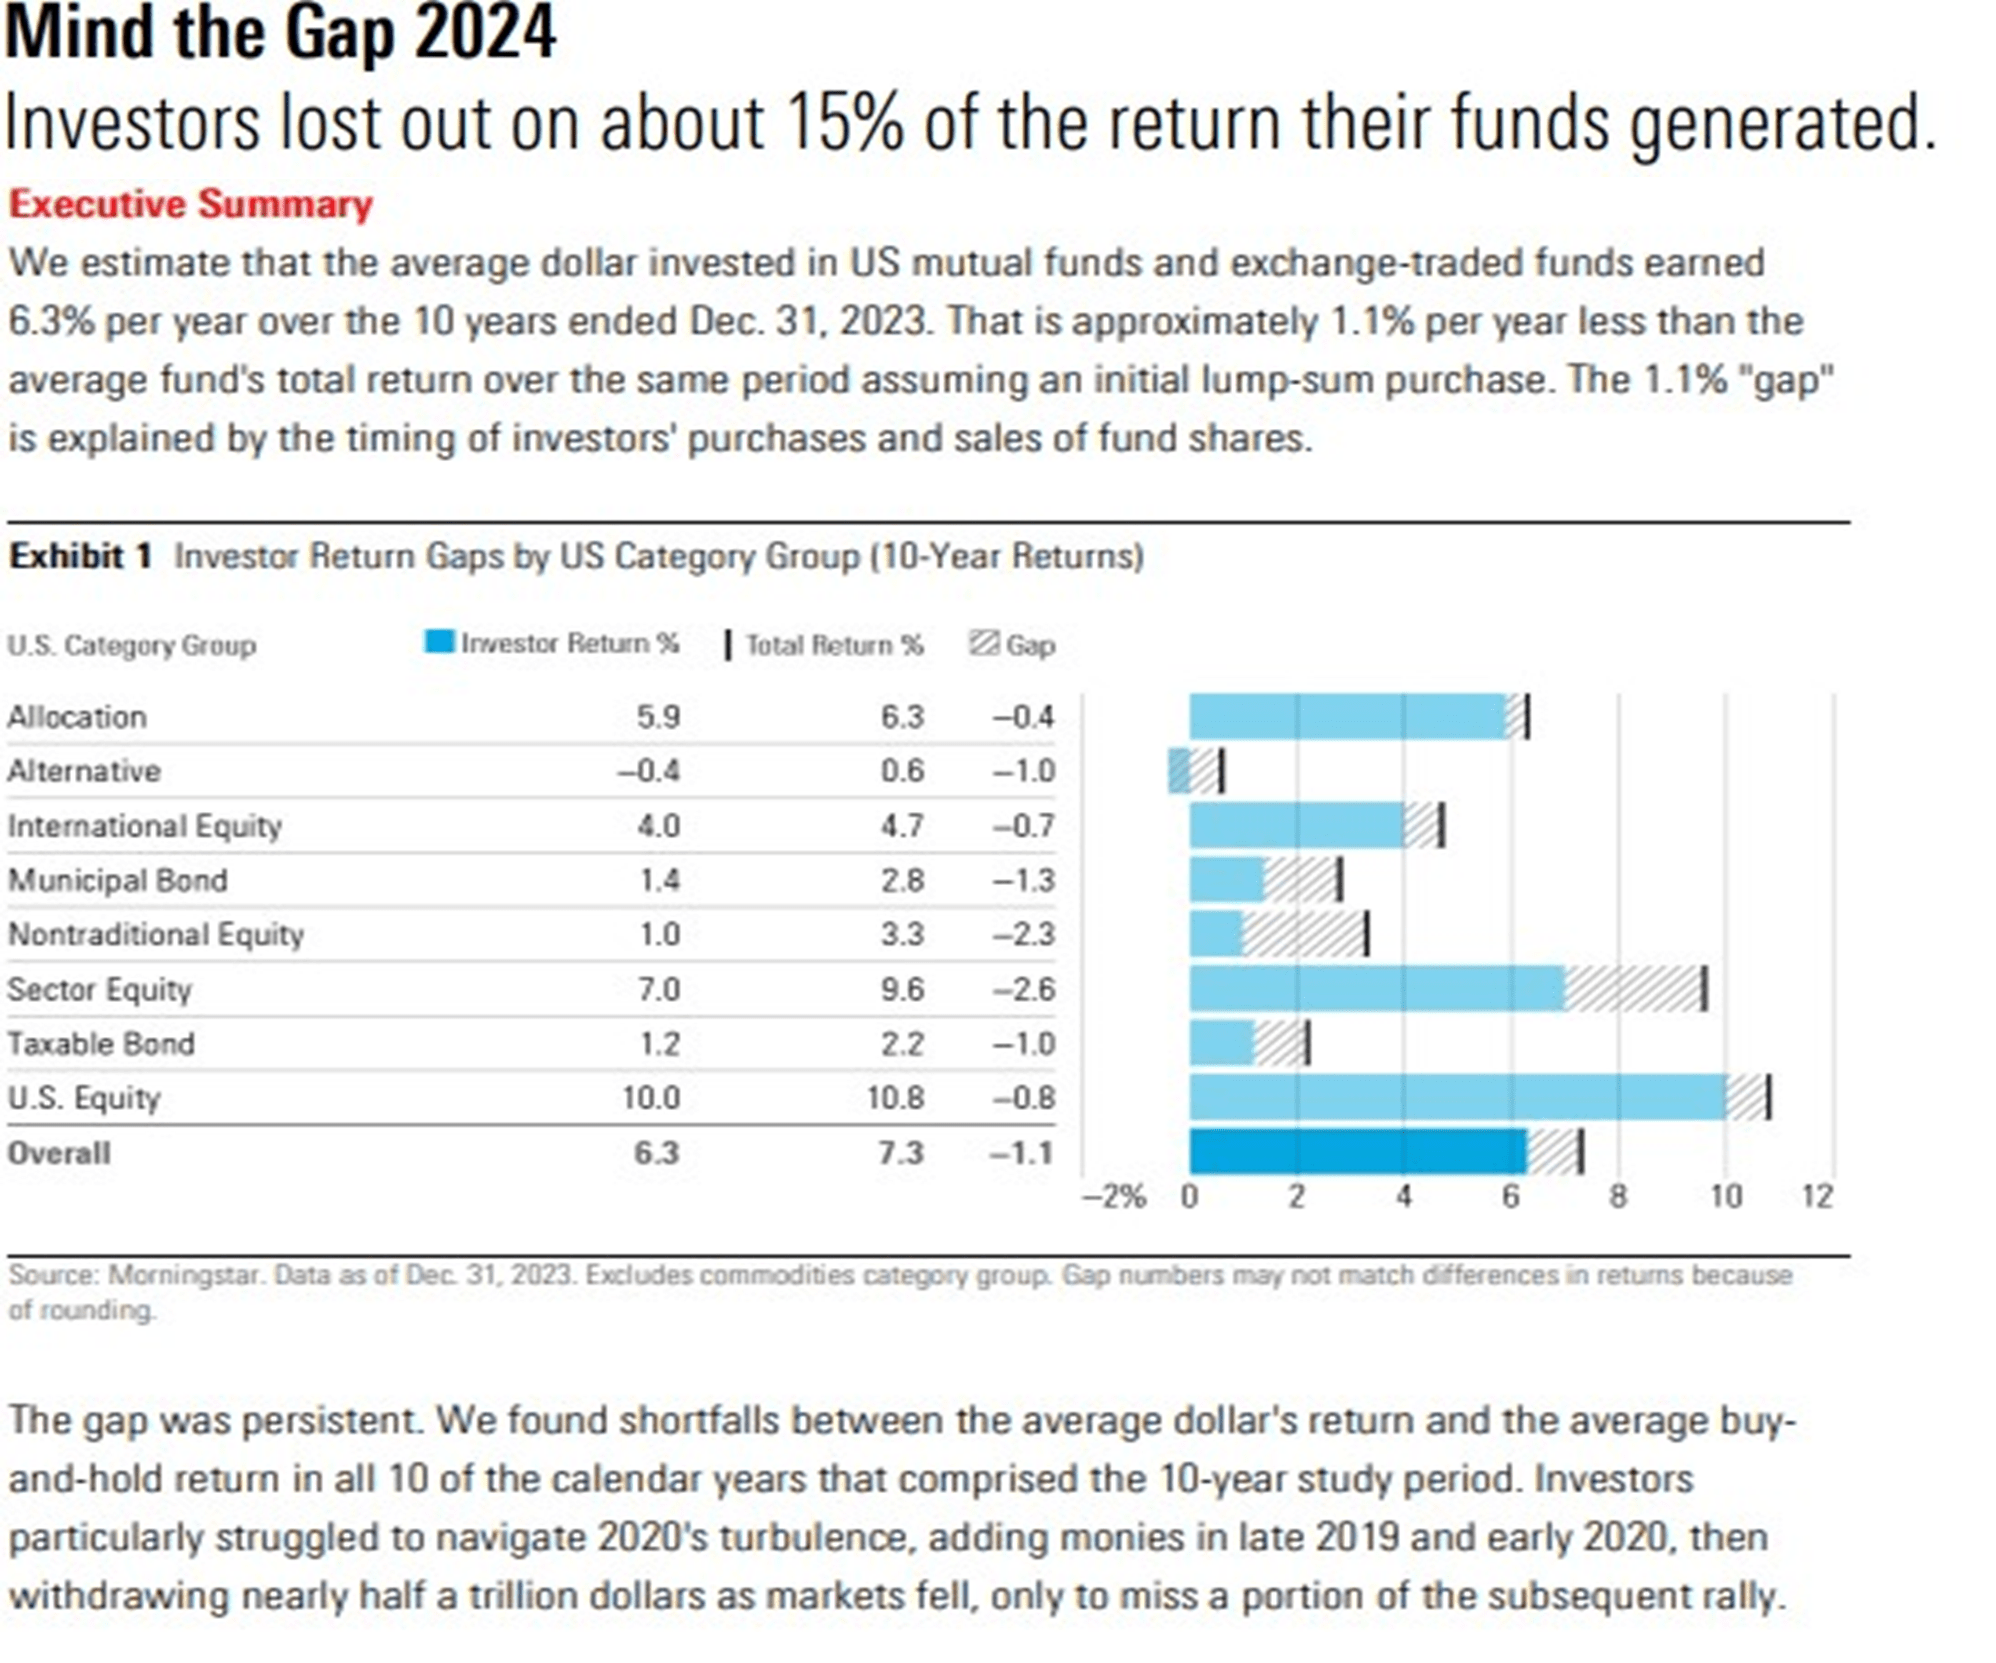
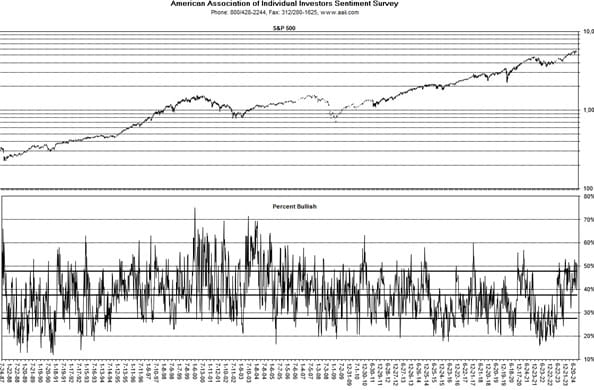
The table on the top of the prior page, shows that in aggregate, investors realized lower returns in all categories of U.S. market segments than the underlying funds themselves. Poor timing (e.g. buying in after favorable results were already evident) is the reason investor results were below the investment vehicles themselves. The table on the bottom of the page is harder to read. Hopefully these comments will help you understand what the data shows. The bottom panel shows the degree to which the participants in the weekly AAII survey expressed whether they held a bullish, neutral, or bearish view on the outlook for the stock market. When the line is high in that panel, they were decidedly bullish and vice versa. The data shows that collectively survey respondents tend to be bullish during periods when the market had performed well and vice versa. Here again, if they just stayed the course with the appropriate asset allocation, they likely would have fared better than their collective attempt to predict the near-term future of the stock market.
“You pay a very high price in the stock market for a cheery consensus.” – Warren Buffett
When news on the economy, interest rates, inflation and on the geopolitical front are favorable, stock valuations tend to move to the high side of historical ranges. Conversely, when uncertainty is high and/or significant challenges are evident, the opposite is often true. Please see the table below.
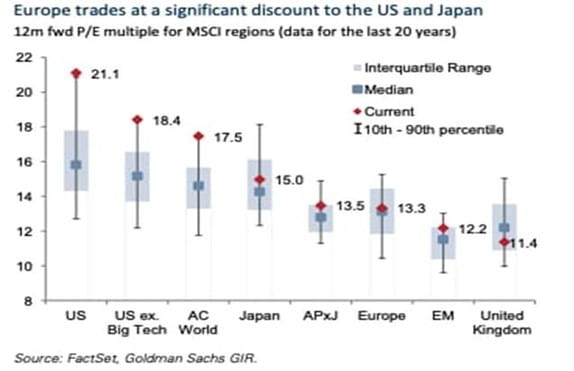
As the table above shows, the U.S. stock market is currently trading on the high side of its historical valuation metrics relative to its 12-month forward PE (price to earnings) multiple. In the past 20 years, it mainly traded between 14.5x and 18x its forward PE. 10% of the time it sold for less than 13x and 10% of the time it sold at its current PE ratio or higher. On the right-hand side, you can see that the U.K. stock market has generally traded at 11x to 14x forward EPS, with about 10% at or below 10x and 10% above 16x over the past 20 years. It is currently trading at the low side of its range. Could the U.S. PE ratio move higher still? Of course. Could the U.K. multiple fall further from here? That too is certainly possible. However, over a multi-year period, we think it is likely that the U.S. valuation multiple may decline from today’s elevated level. Conversely, other market segments that have delivered much lower returns than the U.S. could show improvement in the years ahead.
Collectively, investors tend to get overly optimistic in good times. Then when conditions inevitably change, they experience declines in prices that defy their bullish expectations. Conversely, after periods of poor market conditions and adverse news, investors can become despondent and stock valuations metrics tend to reflect those concerns. My nearly 40 years of experience informs my view that identifying major inflection points is inherently challenging. However, there are several things that are part and parcel of our management approach that help alleviate the need for making near term projections for security gains or losses. As you know, we actively seek to identify market segments that will likely perform differently over time. That’s because leadership changes among ‘growth’ and ‘value’ or U.S. vs. international or large caps vs. mid and small caps are commonplace, but not easy to predict. Instead of asking, ‘Is this segment likely to reverse course and go appreciably higher or lower in the weeks and months that lie ahead?’, we spend more time asking what might make this cheap and decidedly challenged market segment perform well over the next 3, 5 or more years. Conversely, we don’t try to predict when hot segments will lose their mojo over the short term. Rather, we ask what might happen over a multi-year time frame? In both instances, valuation metrics (both absolute and relative to other segments) is a central consideration we use to reduce the risk of being decidedly offsides for an extended period.
In summary, when news on the economy, interest rates, inflation and on the geopolitical front are favorable, stock valuations tend to move to the high side of historical ranges. Conversely, when uncertainty is high and/or significant challenges are evident, the opposite is often true.
As I have conveyed countless times, we are proponents of 1) broad diversification across all-major U.S. and international market segments and 2) sticking with the appropriate stock and bond allocation that suits your long-term needs and preferences.
You will see that I included an addendum of tables and charts that have caught our attention. I have added comments to aid your review and to explain how this data supports our approach to managing portfolios.
Warmest regards,
Richard Jones, CFA
Partner, Harmony Wealth Partners.
Addendum
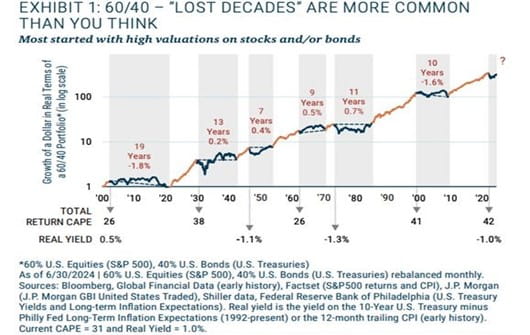
Source: GMO
The chart above shows there are extended periods when an allocation of 60% S&P 500 and 40% U.S. aggregate bonds provide modest returns. Periods of poor returns for the S&P 500 tend to happen when valuation metrics are elevated and then decline. It is akin to riding a bike uphill and/or into a stiff breeze. Today, valuation levels for the S&P 500 are on the high side of its historical range. The good news is that during periods when the S&P 500 and the U.S. bond market perform poorly, other market segments often provide ballast due to rotation of capital into segments that often have more attractive valuation metrics.
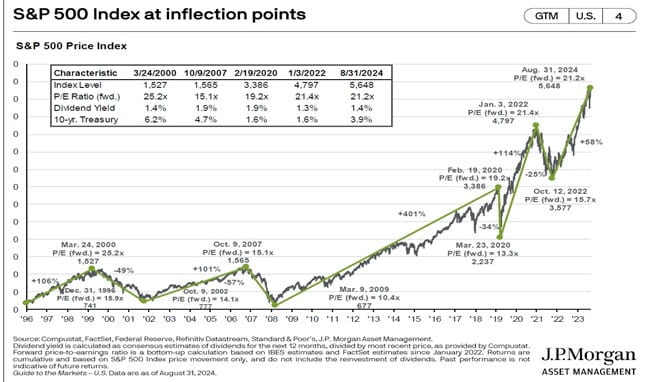
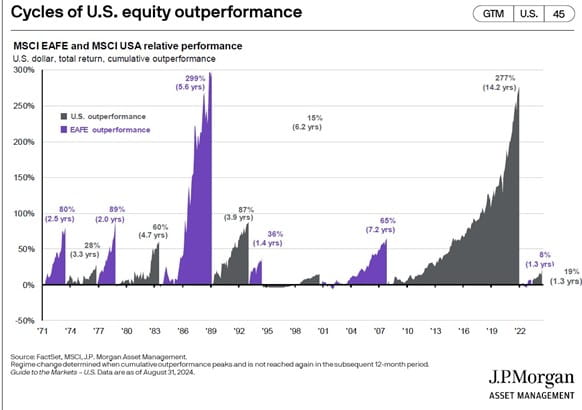
With respect to the chart at the bottom of the prior page, it is clear that highly favorable, extended bull markets begin when valuations and expectations are low. Bear markets - especially the deepest and most contracted stem from high valuations and expectations that embody investor expectations that subsequently prove overly optimistic. At present, valuations for large cap U.S. stocks are elevated - but they can go higher. Conversely expectations and valuations for small and mid, value and international are low/reasonable. It is likely that at some point many investors will discover they are over exposed to expensive assets and that they do not hold meaningful allocations in out of favor segments that may surprise on the upside. We don't know the timing or magnitude of leadership changes. That’s why we diversify, by we actively seek to find opportunities to earn favorable returns that emerge from securities that are unloved in part due to significant periods of so-so to poor investment results.
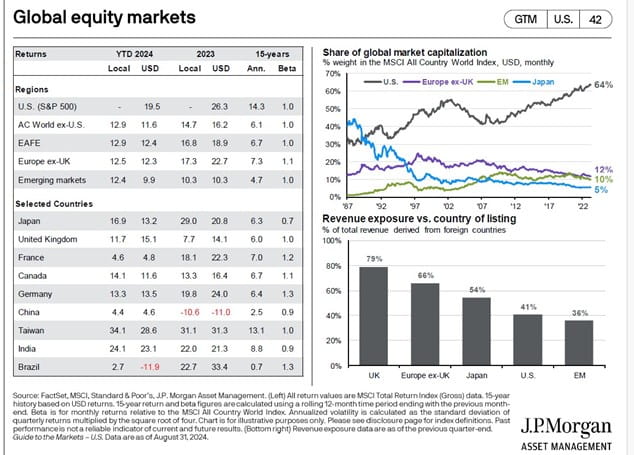
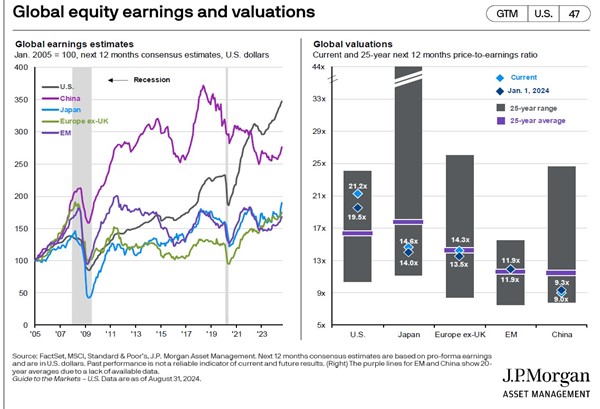
Comment: International markets have trailed the S&P 500 by a considerable margin in most recent years, but relative performance of late has improved compared to the drubbing of the past 15 years. In the top right you can see that Japan had the largest weight in the global stock index in the late 1980s. Back then the U.S. share was about 30%. Today it is about 64%. It’s not going to 100% and if it declines from today’s level, investors will be well served to own other markets. Many international markets are largely out-of-favor and valuation metrics reflect that. If that changes, these markets could once again prove beneficial to own. When valuation metrics increase, it feels like you are riding downhill and/or with the wind at your back. In time, today’s out of favor segments will likely curry favor again and be rewarding to own.
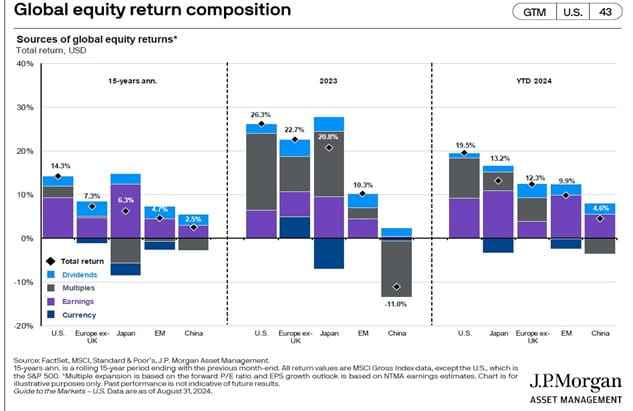
Over the past 15 years, The S&P 500 has been aided by favorable EPS growth and a PE expansion. International market returns have been held in check by declines in the PE multiple and/or declines in the valuation of their currencies relative to the U.S. $. These headwinds may become tailwinds in the quarters and years ahead.
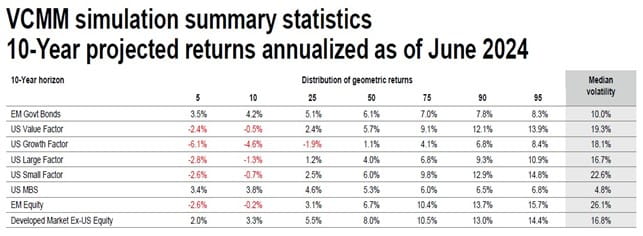
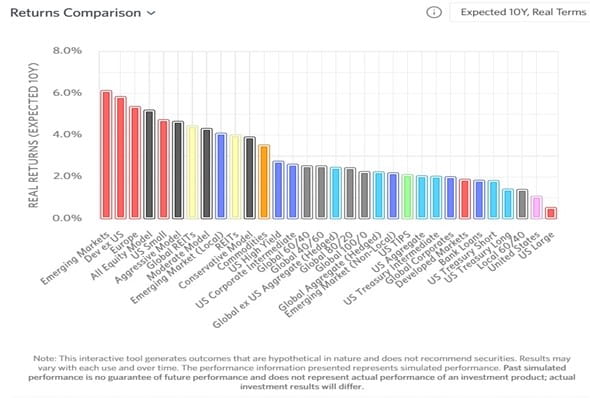
Source: Vanguard
Comment: Vanguard is one of several well-resourced firms that have an expectation that leadership may change over the 5, 10 or more years. In a departure from the past 15 years, their valuation-based modelling suggests that we may well see better relative returns for U.S. value versus growth, U.S. small caps versus large caps and better international (both developed markets and emerging markets) than U.S. large caps (e.g. the S&P 500). Reversion to the mean with respect to valuation metrics is a key factor.
The table at the top of the next page shows, Research Affiliates (another well-thought of firm) has similar estimates expressed in real (e.g., net of inflation) returns.
Source: Research Affiliates, LLC
The table below shows that leadership changes among U.S. and international markets is normal. When this cycle of U.S. dominance may change is unknown. Nevertheless, in light of valuation disparities, we believe investors should be prepared for that outcome.
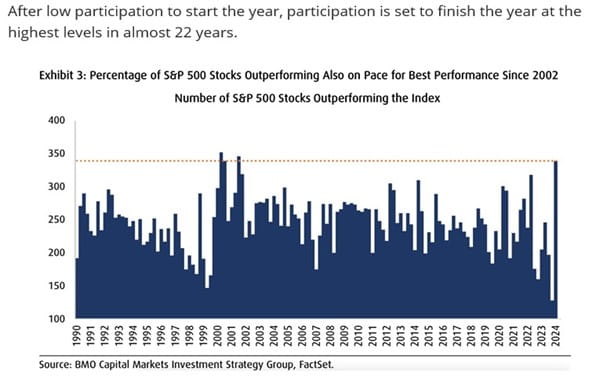
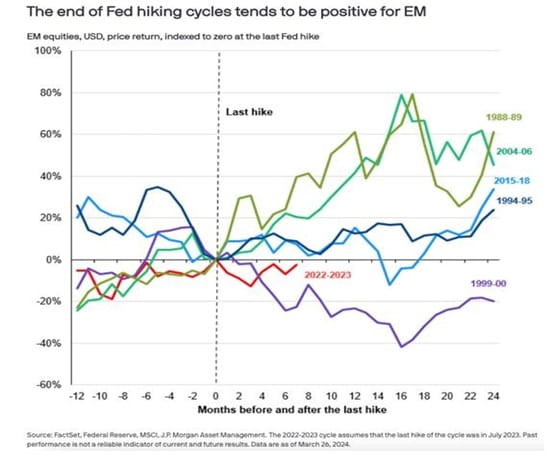
Comment: After significant outperformance by mega caps versus the rest of the S&P 500 and U.S. mid and small caps, we are seeing a broadening of participation. That is healthy and could be a sign of broader participation in the years ahead. Lastly, the table at the top of the next page shows that a catalyst may be at hand for emerging market equities. They have generally performed well during periods when U.S. interest rates are declining.
Source: The Idea Farm
Any opinions are those of the author and not necessarily those of Raymond James. This material is being provided for informational purposes only and is not a complete description, nor is it a recommendation. There is no guarantee that these statements, opinions or forecasts provided will prove to be correct. Investing involves risk and you may incur a profit or a loss regardless of strategy selected. No investment strategy, including diversification, can guarantee your objectives will be met. Prior to making an investment decision, please consult with your financial advisor about your individual situation. The indexes mentioned are unmanaged and cannot be invested into directly. Past performance is no guarantee of future results. International investing involves special risks, including currency fluctuations, differing financial accounting standards, and possible political and economic volatility.
Securities offered through Raymond James Financial Services, Inc., Member FINRA/SIPC. Investment advisory services offered through Raymond James Financial Services Advisors, Inc. Harmony Wealth Partners is not a registered broker/dealer and is independent of Raymond James Financial Services.
