Our Thought's During this Period of Uncertainty
If you are paying attention to markets and headlines, you may be feeling anxious. That’s understandable as stock markets here and abroad have sold off sharply in the past few days and weeks. Indeed, on Monday morning, April 7th, the S&P 500 was poised to open over 20% below its recent highs. That means we are in a ‘bear market.’ While we wish we knew what lies ahead over the next few weeks and months, we do not. That said, we do have a game plan that we believe will provide value for you and those whom you care about.
First, let’s go back a few weeks before the announcement of tariffs. The S&P 500 performed exceedingly well over the past 16 years. Since its Great Financial Crisis low (e.g., 3/09/2009), the S&P 500 rose from 676.53 to 6147.43 on 2/20/25 which is an annualized price gain of 14.7%. This well-above average gain was fueled by a significant rise in EPS from its deep recession lows and a very large increase in its PE ratio. Indeed, in recent years, the S&P 500 has been selling near the high end of its historical valuation range. The challenge is that when valuations and investor expectations are elevated, prices are prone to falling significantly if, and when, economic or geo-political challenges present themselves. While we do not know the timing of or the reasons why we will get back to economic and market gains, we are confident we will overcome today’s challenges. Thus far, declines have proven to be temporary (albeit often more than 10 years in duration at times) while gains are more enduring. Because each decline has different factors that cause concern, it is impossible to accurately predict how much particular market segments will fall or when they will bottom. That said, we do have every confidence that we will continue to see favorable conditions that will enable both economic and corporate earnings growth which pave the way for significant increases in stock market indexes.
So, what is our play book? First and foremost, we are committed to maintaining broad diversification in our equity allocation. That’s because, when sharp declines occur, segments that had been performing well can once again lead when markets improve. That said, it is not uncommon for new leadership to emerge and for former leading segments to continue to face challenges. As I have shared in prior letters, we believe market segments like international markets and U.S. mid, small and/or value segments are more attractively priced than U.S. large cap core and growth segments. Therefore, it would not surprise us if some of these market segments could emerge as leaders in the next bull phase. Last but not least, we are continuing our ongoing practice of harvesting tax losses and rebalancing positions all the while evaluating whether there are opportunities to add new positions. What we will not do is attempt to time in and out of the equity markets. Doing so entails significant risks including being out of the markets whenever ‘unexpected’ sharp reversals upward occur. We remind ourselves that while stocks could fall further, it is likely just a question of time (sometimes a number of years) until we will see new all-time highs. Also, we know that 33% decline requires a 50% gain to get back to achieve a new high. We want to capture those returns and the much greater ones. We remain confident that we are likely to experience significant gains in the years and decades ahead. If markets decline further from here (and they certainly may), we will seek to add to market segments that provide very attractive valuation metrics. Last, but not least, we will continue to be here for you.
As you will see, I have included a couple of charts and tables in an addendum. Per usual, I have provided some commentary that I hope you find helpful. As always, we welcome your comments and questions or any other topics that are top of mind for you.
W. Richard Jones, CFA
Partner, Harmony Wealth Partners
Addendum

Source: J.P.Morgan Asset Management
The chart on the left shows the annual gain or decline in the S&P 500 in each year going back to 1980. The dots and numbers in red show the intra-year decline from top to bottom in each year. We believe this helps explain why timing in and out of the S&P 500 (or other market segments) is so difficult. Price volatility is to be expected, even when we find ourselves in favorable and unfavorable environments.
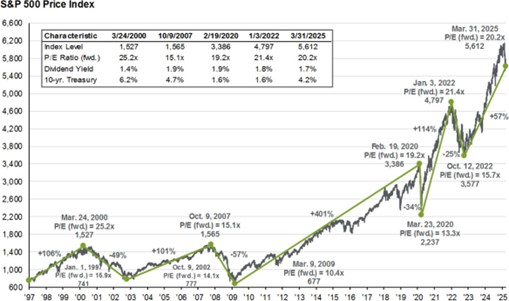
Source: FactSet, Standard& Poor’s, J.P.Morgan Asset Management
The information contained in this letter does not purport to be a complete description of the securities, markets, or developments referred to in this material. The information has been obtained from sources considered to be reliable, but we do not guarantee that the foregoing material is accurate or complete. Any opinions are those of W. Richard Jones and not necessarily those of Raymond James. Expressions of opinion are as of this date and are subject to change without notice. There is no guarantee that these statements, opinions or forecasts provided herein will prove to be correct. Investing involves risk and you may incur a profit or loss regardless of strategy selected, including diversification and asset allocation. Past performance does not guarantee future results. Future investment performance cannot be guaranteed, investment yields will fluctuate with market conditions. Indices are not available for direct investment. Index performance does not include transaction costs or other fees, which will affect actual investment performance.
