Shifting Trend
The Dow Jones Industrial Average has been enjoying a notable winning streak since February 11th. It rallied every day for seven sessions and 13 out of 15…its best performance in more than a year.1 It has been said that "a rising tide lifts all boats." However, last year, it could only be said that "a rising tide lifted a few boats." One of the major stories of 2015 was that the major stock indices were being propped up by the performance of a select few mega-cap stocks, while the rest of the market suffered.
One could argue the stock market has been going through an "internal correction" for seven months while a few of the index stocks have kept the indices elevated. However, in 2016, that narrative has shifted a bit, as the equal-weighted S&P 500 has been the better performer, a possible reflection of improving market breadth.2Indeed, this year most boats seem to fall…and rise together.
Long-Term / Short-Term Predictions
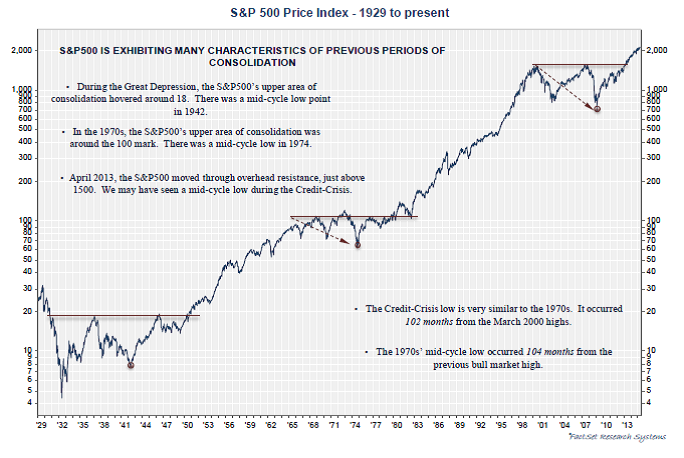
Longer-term, our Chief Investment Stategist Jeff Saut has said last August's low (1812), and subsequent February 2016 retest of that low, put in place a double-bottom. He continues to believe the secular bull market remains in place and has years left to run.2
As the chart below shows, stocks typically enter a long period of expansion after emerging from a negative 10-year holding period (shown by purple line). On average, these secular bull markets have lasted roughly 15 years and delivered average annual returns of about 16%. Given that we just emerged from such a period six years ago, it is not unreasonable to assume there could be 9 years of 10%+ average annual returns left in the current bull market, should performance follow historical patterns.2
Short-term, I believe we could see a V-shaped stock market in 2016. While the first part of the year will be characterized by volatility, the second part of the year could bring a rally through year-end. The market could continue climbing higher from here, or it could retest its recent lows. The driving forces will be the presidential election, and of course, earnings. Typically, the fourth year of an election cycle is characterized by market strength. Then again, this has not been a typical election year.3 In my opinion, once we have narrowed down to two presidential candidates, we will see more of the fourth-year election cycle effect on the stock market. Earnings in 2015 for the S&P 500 were approximately $100. Projected earnings for 2016 are approximately $119, and $137 for next year. The S&P 500 is currently selling at 14.8x next year’s estimate.
We trust that the “tide” will continue to rise, and we renew our commitment to invest in “boats” with the greatest potential to rise. Thank you for the opportunity to serve you.
MCT: cat
1Morning Tack, Jeff Saut, March 22, 2016
2Gleanings, Jeff Saut, March 15, 2016
3Blue Chip Growth,Louis Navellier, April 2016
Past performance does not guarantee future results and there is no assurance that the objectives will be met. Investing involves risk and you may incur a profit or a loss. The information and opinions provided have been obtained from sources believed to be reliable but no independent verification has been made, nor is its accuracy or completeness guaranteed. Expressions of opinion are as of this date and are subject to change without notice. The opinions expressed are provided solely for informational purposes and not to be construed as a solicitation or an offer to buy or sell any securities or related financial instruments. Long-term investing does not insure a profitable outcome. Investing in oil involves special risks, including the potential adverse effects of state and federal regulation and may not be suitable for all investors. There are additional risks associated with investing in an individual sector, including limited diversification. The S&P 500 is an unmanaged index of 500 widely held stocks and is generally considered representative of the US equity market. It is not possible to invest directly in an index. Investment Management Consultants Association (IMCA®) is the owner of the certification marks "CIMA®" and "Certified Investment Management Analyst®". Use of CIMA® or Certified Investment Management Analyst® signifies that the user has successfully completed IMCA’s initial and ongoing credentialing requirements for investment management consultants.
