
It’s the fourth quarter…and despite Covid-19 and politics, life goes on. Pigskins are filling the air from our back yard in Dunwoody to Grant Field, Sanford Stadium, Jordan-Hare, The Swamp, Bryant-Denny, Death Valley and eventually all the way to the Horseshoe. Not only is football back…the Master’s is scheduled for November.
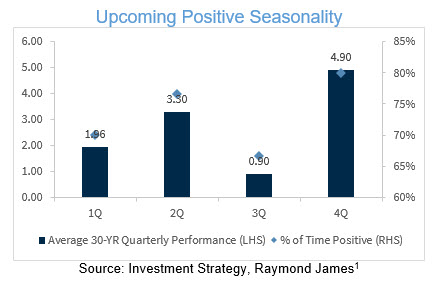
There is also excitement in the air as we enter the historically powerful 4th quarter of the year with very positive earnings expectations over the next several weeks and increased strength in the economy.
Fourth Quarter Drama
This year’s 4th quarter has the added element of election drama. One has wisely said, “Election outcomes are impossible to predict until they become inevitable.”1 However, we will attempt to outline the likelihood of two possible scenarios and their potential effect on equity markets.
Market Impact: When Pennsylvania was called for Donald Trump in the wee hours of the morning 2016, the Dow futures cratered nearly 900 points.6 However, by the time the market opened the next morning, it was up and went on to rally nearly 50% during the next fifteen months.7
Likelihood: Whoever wins Ohio has gone on to win The Presidency in each of the last fourteen elections...and twenty-nine of the last thirty-one elections. Currently Trump and Biden are tied at 47% in Ohio.3 Using that metric, the odds would be 50/50.
Equity market performance currently favors President Trump. Market performance in the three-month period leading up to an election has a strong predictive power going back to 1920.1 If the market is positive in the three months leading up to the election, it favors the incumbent. If it is negative during that time period, it favors the challenger. This has proven true 87% of the time.1 For the 2020 election, that period started August 3rd when the S&P stood at 3294. It now stands at 3446 (4.6% above August 3rd levels). Of course, we have less than a month left to go, but this metric currently favors President Trump.
Market Impact: History has shown that the stock market has also performed well under Democratic presidents. The market rose 183% during Barack Obama’s eight years and 210% while Bill Clinton was President.4 While investors have concerns about the potential for higher taxes, it would likely take a great deal of time and compromise to ever actually make it through Congress. Biden also claims he will not raise taxes on anyone earning less than $400,000.5
Likelihood: Biden appears to be leading in the polls for the national popular vote as well as in important swing states.3 If these polls are indeed accurate this metric would seem to favor the former vice-president.
The chart below shows typical historical performance of the market (S&P 500) when the incumbent wins (dark blue line) and loses (light blue line). The vertical line is election day. You can see when the incumbent wins, the market tends to smoothly glide upwards and when the incumbent loses it tends to correct going into the election and then settle back into an uptrend. In both cases, the market rallies after the election.
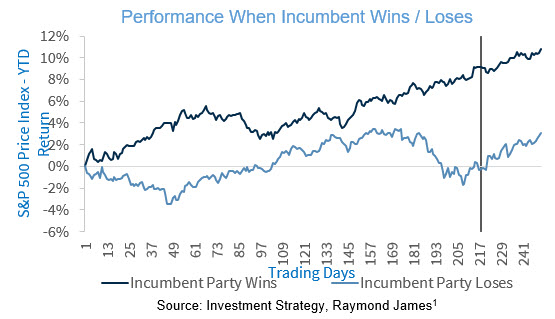
The market has proven itself to be about as partisan as a pigskin. It has flown high with little respect to who is in the Oval Office. Indeed, as one has wisely said…
Presidents don’t make markets…markets make presidents.2
Dating back to 1932, the average S&P 500 annual return while Republicans have been president is 8.6% while the average when Democrats are president is 8.5%.
We’ve heard much talk about a “V-shaped recovery”. However, what we have really seen is a “K-shaped recovery”. Certain sectors like technology and interactive home entertainment have actually benefited from the pandemic, making the “straight up” portion of the K. 1
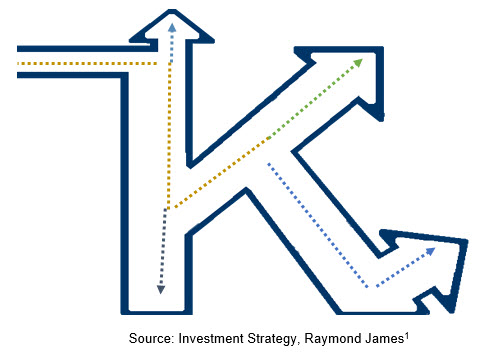
Other areas such as home improvement, biotech, and medical supplies make up the V-shaped portion of the K. 1 Others such as restaurants, hotels and airlines are trying to recover, but their recovery is still delayed, making up the “foot” portion of the K. 1 Still others like energy and real estate declined and will likely continue to struggle, representing the “straight down” portion of the K. 1
Indeed, the dispersion between the best-performing sectors and the worst performing sectors has been record-setting. Year to date, the difference between the best-performing sector (Technology up ~30% year to date) and the worst-performing sector (Energy down ~50% year to date) is 80%.1 The importance of thorough research and active portfolio management has perhaps never been greater. Sector analysis and stock selection are critical.
It’s the “fourth quarter”…there will likely be ups and downs, dramatic turns of events, and unexpected “calls”, but we believe the fourth quarter could be the strongest yet. Fall is typically a happier time of year…football season, cooler weather, and Thanksgiving and Christmas are coming.
As always, let us know if there’s anything else we can do to serve you.
Malcolm C. Tarver, III
Senior Vice President, Investments
Certified Investment Management Analyst ®
1Investment Strategy, Raymond James, October 5, 2020
2Jeff Saut, CNBC, September 2020
3CNN.com, October 2, 2020
4InvestorPlace, Brian Hunt, August 2, 2020
5Louis Navellier, September 29, 2020
CNNMoney, November 9, 2016
7MarketSmith Charts, October 7, 2020
Any opinions are those of Malcolm Tarver and not necessarily those of Raymond James. The foregoing information has been obtained from sources considered to be reliable, but we do not guarantee that it is accurate or complete. Expressions of opinion are as of this date and are subject to change without notice. Investing involves risk and you may incur a profit or loss regardless of strategy selected. Indices are not available for direct investment. Any investor who attempts to mimic the performance of an index would incur fees and expenses which would reduce returns. The Dow Jones Industrial Average (DJIA), commonly known as “The Dow” is an index representing 30 stock of companies maintained and reviewed by the editors of the Wall Street Journal. Past performance is not indicative of future results. There is no assurance these trends will continue or that forecasts mentioned will occur. The S&P 500 is an unmanaged index of 500 widely held stocks that is generally considered representative of the U.S. stock market. Keep in mind that individuals cannot invest directly in any index, and index performance does not include transaction costs or other fees, which will affect actual investment performance. Individual investor's results will vary. Dividends are not guaranteed and must be authorized by the company's board of directors.
