Chief Economist Eugenio J. Alemán discusses current economic conditions.
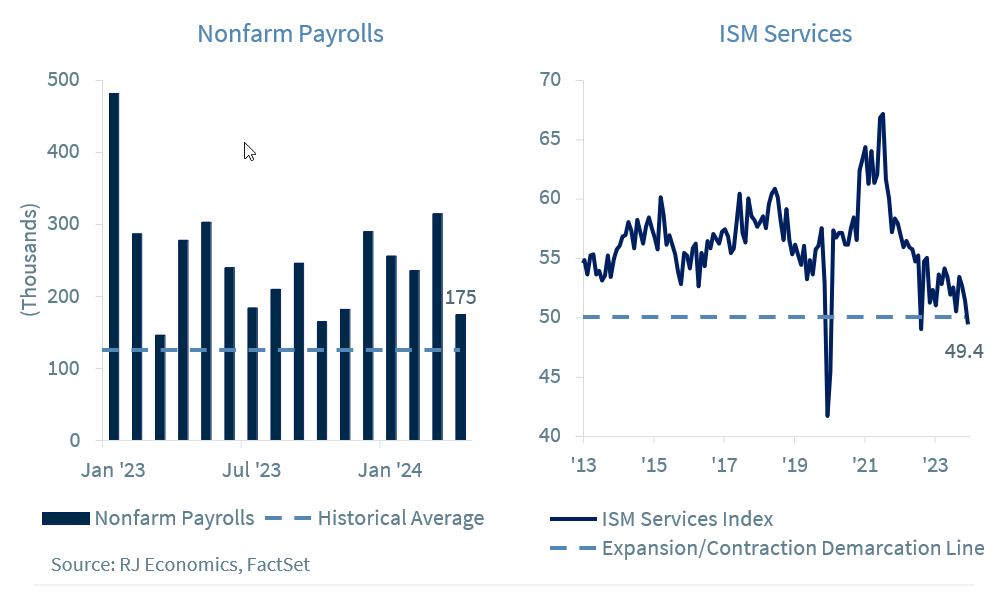
We try not to react to just one data point because, as we have always said, “a data point doesn’t a trend make.” Furthermore, we don’t know if this is just a one-time event or if it is the start of something more. But we have been expecting a slowdown in economic activity for a while, and April’s 175,000 nonfarm payrolls is the first sign that maybe, just maybe, our expectation for a slowdown in economic activity is finally here.
If you look at our forecast, we are still expecting a slowdown in economic activity, if not for any reason other than the famous “long and variable lags of monetary policy” which, for this cycle, have been really, really, long!
Still, the 167,000 jobs created by the private sector are very strong compared to a historic average of employment growth in the U.S. economy. Furthermore, most of the jobs, 95,000, were in the private education and health services sector, but mostly in the health services sector, which typically does well in a growing as well as in a weak economic environment.
But today we had a potentially second not-so-good number, the ISM Services Index, which went into contraction territory for the first time since December of 2022. Thus, the ISM Services joined the ISM Manufacturing Index in April with both in contraction for the first time in several years, which could create problems for the economy, for firms, and for the Federal Reserve (Fed).
Comments by firms that were included in the release of the ISM Services Index complained about increases in costs due to high labor and other input costs, which does not bode well for margins going forward. Although firms must continue to buy some of the inputs used in their businesses, the largest costs are labor costs. In general, 70% of businesses’ input costs are represented by the cost of labor. Thus, we expect that the weakness seen in the employment market in April to continue during the next several quarters as some industries slow hiring and others even start to cut jobs.
For the Fed, its decisions will become more difficult in an environment of relatively high inflation. However, we still think the disinflationary path is in place and that the Fed will be able to start lowering interest rates by mid year, against what markets believe today.
The Summary of Economic Projections (SEP) has been a great informative instrument from the Fed and has contributed considerably to our understanding of Fed policymaking, especially as it includes the dot plot which, although Fed officials say is not a ‘forecast,’ helps analysts understand the potential path for U.S. interest rates. However, there are eight Federal Open Market Committee (FOMC) meetings per year but only four of these FOMC meetings include a release of the SEP.
We understand that preparing an SEP during every meeting of the FOMC may be a lot of work, but it is probably nothing compared to the uncertainty generated by not publishing an SEP, as markets have to do guess work on how Fed officials’ views have changed during the ‘dark’ period when an SEP is not released.
Case in point is what has happened between the release of the March SEP, when we argued that it was clear that the dot plot was in flux while adding March’s inflation number, which probably has made many of the members of the FOMC change their mind regarding where they want to go with interest rates. However, under today’s SEP schedule, markets will have to wait until the release of the June SEP on June 12, 2024, to know how members’ views of the path of the federal funds rate has been affected by the recent data releases.
If the SEP is too much, at least releasing a new dot plot at each meeting would be a very good addition to markets as it would reduce speculation about what Fed members are thinking during the period. In normal circumstances, a dot plot would probably not be very helpful, but since these times have been anything but normal, having access to a dot plot would help reduce the volatility created by lack of information.
Economic and market conditions are subject to change.
Opinions are those of Investment Strategy and not necessarily those of Raymond James and are subject to change without notice. The information has been obtained from sources considered to be reliable, but we do not guarantee that the foregoing material is accurate or complete. There is no assurance any of the trends mentioned will continue or forecasts will occur. Last performance may not be indicative of future results.
Consumer Price Index is a measure of inflation compiled by the US Bureau of Labor Statistics. Currencies investing is generally considered speculative because of the significant potential for investment loss. Their markets are likely to be volatile and there may be sharp price fluctuations even during periods when prices overall are rising.
Consumer Sentiment is a consumer confidence index published monthly by the University of Michigan. The index is normalized to have a value of 100 in the first quarter of 1966. Each month at least 500 telephone interviews are conducted of a contiguous United States sample.
Personal Consumption Expenditures Price Index (PCE): The PCE is a measure of the prices that people living in the United States, or those buying on their behalf, pay for goods and services. The change in the PCE price index is known for capturing inflation (or deflation) across a wide range of consumer expenses and reflecting changes in consumer behavior.
The Consumer Confidence Index (CCI) is a survey, administered by The Conference Board, that measures how optimistic or pessimistic consumers are regarding their expected financial situation. A value above 100 signals a boost in the consumers’ confidence towards the future economic situation, as a consequence of which they are less prone to save, and more inclined to consume. The opposite applies to values under 100.
Certified Financial Planner Board of Standards Inc. owns the certification marks CFP®, CERTIFIED FINANCIAL PLANNER™, CFP® (with plaque design) and CFP® (with flame design) in the U.S., which it awards to individuals who successfully complete CFP Board's initial and ongoing certification requirements.
Links are being provided for information purposes only. Raymond James is not affiliated with and does not endorse, authorize or sponsor any of the listed websites or their respective sponsors. Raymond James is not responsible for the content of any website or the collection or use of information regarding any website's users and/or members.
GDP Price Index: A measure of inflation in the prices of goods and services produced in the United States. The gross domestic product price index includes the prices of U.S. goods and services exported to other countries. The prices that Americans pay for imports aren't part of this index.
The Conference Board Leading Economic Index: Intended to forecast future economic activity, it is calculated from the values of ten key variables.
The Conference Board Coincident Economic Index: An index published by the Conference Board that provides a broad-based measurement of current economic conditions.
The Conference Board lagging Economic Index: an index published monthly by the Conference Board, used to confirm and assess the direction of the economy's movements over recent months.
The U.S. Dollar Index is an index of the value of the United States dollar relative to a basket of foreign currencies, often referred to as a basket of U.S. trade partners' currencies. The Index goes up when the U.S. dollar gains "strength" when compared to other currencies.
The FHFA House Price Index (FHFA HPI®) is a comprehensive collection of public, freely available house price indexes that measure changes in single-family home values based on data from all 50 states and over 400 American cities that extend back to the mid-1970s.
Import Price Index: The import price index measure price changes in goods or services purchased from abroad by U.S. residents (imports) and sold to foreign buyers (exports). The indexes are updated once a month by the Bureau of Labor Statistics (BLS) International Price Program (IPP).
ISM New Orders Index: ISM New Order Index shows the number of new orders from customers of manufacturing firms reported by survey respondents compared to the previous month. ISM Employment Index: The ISM Manufacturing Employment Index is a component of the Manufacturing Purchasing Managers Index and reflects employment changes from industrial companies.
ISM Inventories Index: The ISM manufacturing index is a composite index that gives equal weighting to new orders, production, employment, supplier deliveries, and inventories.
ISM Production Index: The ISM manufacturing index or PMI measures the change in production levels across the U.S. economy from month to month.
ISM Services PMI Index: The Institute of Supply Management (ISM) Non-Manufacturing Purchasing Managers' Index (PMI) (also known as the ISM Services PMI) report on Business, a composite index is calculated as an indicator of the overall economic condition for the non-manufacturing sector.
Consumer Price Index (CPI) A consumer price index is a price index, the price of a weighted average market basket of consumer goods and services purchased by households. Changes in measured CPI track changes in prices over time.
Producer Price Index: A producer price index (PPI) is a price index that measures the average changes in prices received by domestic producers for their output.
Industrial production: Industrial production is a measure of output of the industrial sector of the economy. The industrial sector includes manufacturing, mining, and utilities. Although these sectors contribute only a small portion of gross domestic product, they are highly sensitive to interest rates and consumer demand.
The NAHB/Wells Fargo Housing Opportunity Index (HOI) for a given area is defined as the share of homes sold in that area that would have been affordable to a family earning the local median income, based on standard mortgage underwriting criteria.
The S&P CoreLogic Case-Shiller U.S. National Home Price NSA Index measures the change in the value of the U.S. residential housing market by tracking the purchase prices of single-family homes.
The S&P CoreLogic Case-Shiller 20-City Composite Home Price NSA Index seeks to measures the value of residential real estate in 20 major U.S. metropolitan.
Source: FactSet, data as of 7/7/2023