Picking out the wheat from the chaff (the winners from the losers) is easy right?
Picking out the wheat from the chaff (the winners from the losers) is easy right?
“Herd mentality bias is one of many common obstacles identified in Behavioral Finance.”i Markets are known to be efficient, but that doesn’t mean they don’t get out of kilter on the high and the low side for extended periods from time to time. John Maynard Keynes warned, “Markets can remain irrational longer than you can remain solvent.” In other words, you might consider ‘the market’ let alone an individual security to be priced way too high (or low), but that doesn’t mean that if you bet against it, you won’t get steamrolled. Standing apart from what others are doing is psychologically difficult. That’s particularly true for investors who are squarely focused on the price trends of the recent past (e.g., last 5, 10 or more years) and excessively attuned to current news – especially price movements. In sum, the herd is most comfortable with concentrating their investments in what is ‘clearly working,’ and where the news is favorable. Conversely, herd investors find it easy to shun segments that are not performing well and where news headlines are not positive. Much of the time, staying in the herd works quite well and psychologically it is relatively easy. Bull market phases can make investors complacent because risks seem low because the consensus among the herd is the high that the rewards are likely only just beginning. Let’s, take a look at the returns within the S&P 500 sectors these past 10 years.
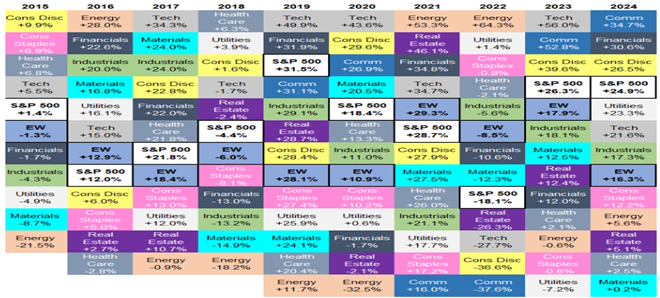
Sources: S&P.com and A Wealth of Common Sense
First, there were fewer rows in earlier years because, Real Estate was first added in 2016 and the Communications sector was added in 2019. Tech led all sectors in 4 of the last 10 years and it only under-performed the aggregate S&P 500 index in 2022 and 2024. The table at the top of page 2 shows, the S&P 500 (middle line in the chart) performed quite well in the 10 years ending 12/31/24. It rose from 2058.9 to 5996.7 (e.g., 186.7%). The tech sector (top line) was magnificent. The S&P tech sector rose 566% over the same period. The worst sector was the energy sector (bottom line). Its price rose just 11.6% over the most recent decade.
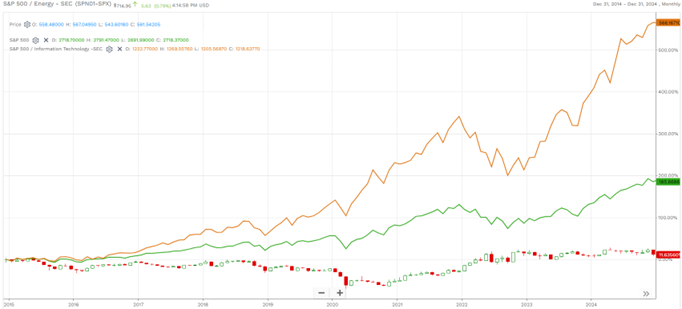
Source: FactSet
Alas it wasn’t always this way. Severe underperformance in the prior 15 years paved the way for the outperformance of the most recent 10 years.
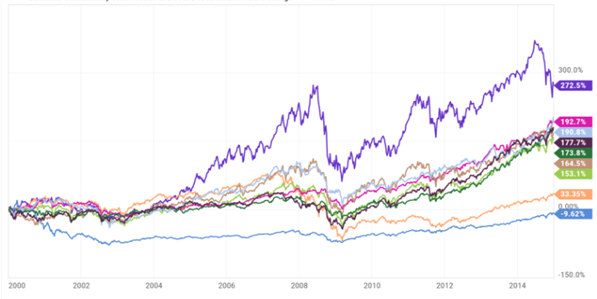
Sources: S&P sectors data and YCHARTS
The winning sector from year end 1999 thru year end 2014 in purple was the energy sector. It increased 272.5% (price change only). The one at the bottom in blue was the S&P technology sector. It was 9.6% lower at the end of that 15-year period. As I have shared in prior letters, investment flows data show that investors added record amounts of money into the then hot tech sector in early 2000. Timing of those investment allocations were extremely poor as the tech laden NASDAQ index was 78% lower in March 2009 than its highs in March 2000.
A bias that is closely related to herd mentality bias is Confirmation Bias. Our species has a strong propensity for seeking out news that conforms to our beliefs and we tend to ignore information that doesn’t. Perhaps because I spent the first 8 years of my career in this business as an equity analyst, I have had a proclivity to incorporate valuation (both absolute and relative to other market segments) into my framework for selecting investments that could provide attractive prospective returns. I have an ever-growing appreciation for the benefit of diversification.
“We have to invest in the world we live in, not the one we want.” – Charlie Munger
When you think about it, it's easy to understand how and why markets tend to fluctuate as much as they do. The economy has cycles (e.g., periods of above average growth as well as stagnation and/or decline). In turn, these economic cycles lead to even larger increases and decreases in corporate profitability (e.g. earnings per share). These fluctuations pale in comparison to movements in the stock markets. At the top of the market in early 2000, the S&P 500 traded at roughly 30x earnings. At the bottom in 2009 it traded at 10x lower recessionary earnings. Its price was down about 50% from its 2000 high. Recently, we have seen and benefited from near record PE ratios combined with record profitability for the S&P 500. The price level has increased roughly 9-fold from the lows of 2009. Data shows that investors tend to add more aggressively into the best performing market segments (and the overall market generally) at what prove to be bull phase highs. In aggregate, investors tend to be net-sellers near market bottoms (and often years after a new bull phase begins), so most investors experience results that are not as favorable as the they would experience if they simply bought and held their investments. At what prove to be major inflection points in market segment performance, most investors are caught off-sides. They own too much of the segments that subsequently fall and too little of those that provide new leadership. When things are going swimmingly well and the winners are obvious, I have found it helpful to ask - how much are these favorable conditions priced in? What might happen if the favorable news changes?
“The four most dangerous words in investing are: “It’s different this time.” – John Templeton
Sir John Templeton, known as the Grandfather of International Investing also, famously said, “Bull-markets are born on pessimism, grow on skepticism, mature on optimism and die on euphoria.” When leadership is well established and it is easy to identify those segments that have been highly rewarding to own as well as those that have been performing poorly, it can be helpful to play Devil’s Advocate and ask things like –
- ‘Will the most ardently loved securities and market segments continue to dominate returns (or at least provide ‘above average returns, no matter how I hold these securities?’
- ‘What could possibly change the bullish thesis?’
- ‘Are there any possible currency, geo-political risks or opportunities, etc., that could change the direction of price/value in this security?’
- ‘Are low valuation metrics that have rarely been seen evident in the clearly un-loved segments?’
We are aware of where the best performance has been globally. Without question, it has been U.S. large cap and especially technology for many years now. In November and December, we saw record inflows into U.S. stock vehicles. These inflows are once again highly concentrated as was the case in early 2000. Investors clearly think the best place to add is in the market segments that have been the most rewarding for a considerable time. They expect that prices for the best performing segments are destined to rise further (e.g. they are still undervalued). History strongly shows that sea changes occur – typically when they are least expected. That being the case and in recognition that timing is inherently difficult and fraught with risk, we consciously allocate the equity portion of your portfolios (and ours) in a manner that tends to reduce volatility compared to ownership of things like the S&P 500 index (let alone the underlying economic sectors that compose the index). We incorporate valuation in our decisions to buy and sell market segments. We actively seek to identify and own securities that tend to perform differently from one another along the way, but that we believe otherwise can contribute to your long-term financial well-being. We allocate capital on a multi-year basis, we exercise patience and remain steadfast in belief and long-standing investment approach that broad diversification, informed by valuation considerations, fosters favorable intermediate and long-term outcomes.
We are committed to your financial well-being and thankful for the privilege to serve as stewards of your wealth.
Richard Jones, CFA
Partner, Harmony Wealth Partners
[i] The Corporate Finance Institute has identified ten common biases that many investors can exhibit to varying degrees that can individually or collectively make errors that cause us to experience sub-optimal outcomes. Afterall, we are human not robots and emotions and biases can adversely affect outcomes. Here is the list –
Below is a list of the top 10 types of cognitive bias that exist in behavioral finance.
#1 Overconfidence Bias
Overconfidence results from someone’s false sense of their skill, talent, or self-belief. It can be a dangerous bias and is very prolific in behavioral finance and capital markets. The most common manifestations of overconfidence include the illusion of control, timing optimism, and the desirability effect. (The desirability effect is the belief that something will happen because you want it to.)
#2 Self Serving Bias
Self-serving cognitive bias is the propensity to attribute positive outcomes to skill and negative outcomes to luck. In other words, we attribute the cause of something to whatever is in our own best interest. Many of us can recall times that we’ve done something and decided that if everything is going to plan, it’s due to skill, and if things go the other way, then it’s just bad luck.
#3 Herd Mentality
Herd mentality is when investors blindly copy and follow what other famous investors are doing. When they do this, they are being influenced by emotion, rather than by independent analysis. There are four main types: self-deception, heuristic simplification, emotion, and social bias.
#4 Loss Aversion
Loss aversion is a tendency for investors to fear losses and avoid them more than they focus on trying to make profits. Many investors would rather not lose $2,000 than earn $3,000. The more losses one experiences, the more loss averse they likely become.
#5 Framing Cognitive Bias
Framing is when someone makes a decision because of the way information is presented to them, rather than based just on the facts. In other words, if someone sees the same facts presented in a different way, they are likely to come to a different conclusion about the information. Investors may pick investments differently, depending on how the opportunity is presented to them.
#6 Narrative Fallacy
The narrative fallacy occurs because we naturally like stories and find them easier to make sense of and relate to. It means we can be prone to choose less desirable outcomes due to the fact they have a better story behind them. This cognitive bias is similar to the framing bias.
#7 Anchoring Bias
Anchoring is the idea that we use pre-existing data as a reference point for all subsequent data, which can skew our decision-making processes. If you see a car that costs $85,000 and then another car that costs $30,000, you could be influenced to think the second car is very cheap. Whereas, if you saw a $5,000 car first and the $30,000 one second, you might think it’s very expensive.
#8 Confirmation Bias
Confirmation bias is the idea that people seek out information and data that confirms their pre-existing ideas. They tend to ignore contrary information. This can be a very dangerous cognitive bias in business and investing.
#9 Hindsight Bias
Hindsight bias is the theory that when people predict a correct outcome, they wrongly believe that they “knew it all along”.
#10 Representativeness Heuristic
Representativeness heuristic is a cognitive bias that happens when people falsely believe that if two objects are similar then they are also correlated with each other. That is not always the case.
Source: corporatefinanceinstitute.com
The information contained in this (insert) does not purport to be a complete description of the securities, markets, or developments referred to in this material. The information has been obtained from sources considered to be reliable, but we do not guarantee that the foregoing material is accurate or complete. Any opinions are those of [INSERT NAME] and not necessarily those of Raymond James. Expressions of opinion are as of this date and are subject to change without notice. There is no guarantee that these statements, opinions or forecasts provided herein will prove to be correct. Investing involves risk and you may incur a profit or loss regardless of strategy selected, including diversification and asset allocation. Past performance does not guarantee future results. Future investment performance cannot be guaranteed, investment yields will fluctuate with market conditions. Indices are not available for direct investment. Index performance does not include transaction costs or other fees, which will affect actual investment performance. Past performance is not indicative of future results. This index is a broad-based measurement of changes in stock market conditions based on the average performance of 500 widely held common stocks. It consists of 400 industrial, 40 utility, 20 transportation, and 40 financial companies listed on U.S. market exchanges. This is a capitalization-weighted calculated on a total return basis with dividends reinvested. The S&P represents about 75% of the NYSE market capitalization. Covers 4500 stocks traded over the counter. Represents many small Composite index company stocks but is heavily influenced by about 100 of the largest NASDAQ stocks. A value weighted index calculated on price change only and does not include income. The companies engaged in the communications and technology industries are subject to fierce competition and their products and services may be subject to rapid obsolescence.
