Reversals often occur when they are least expected
You likely know that the U.S. indexes have declined modestly in recent weeks and months. You may be surprised to learn that international markets, including the major markets in Europe and emerging markets broadly, have risen decently so far this year. As of the close on Wednesday, March 19, the MSCI China index is up 23.4% vs. a decline of 8.1% for the NASDAQ. Whether this is the beginning of a new trend remains to be seen but, changes in leadership often catch many investors offsides. This is especially true when ‘foreign markets’ transition from poor performance to appreciably better. The chart below shows the relevant performance of the MSCI emerging markets index relative to the S&P 500 over the past nearly 40 years.
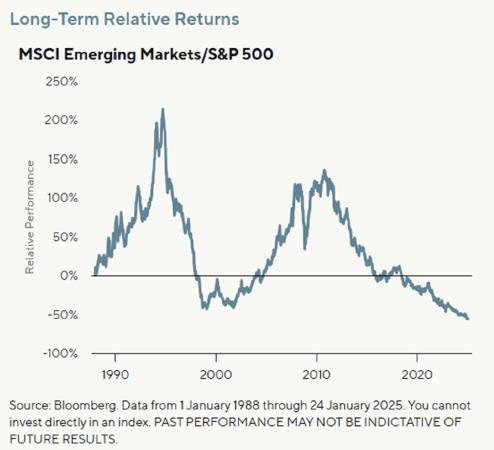
Here are a few comments to help you make sense of the chart to the left. From January 1, 1988, until the mid-1990s, the MSCI emerging markets index outpaced the return for the S&P 500, by over 200%. Then during the mid to late 1990s, the S&P 500 (and NASDAQ) indexes trounced EM stock indexes and other market segments including U.S. small and midcaps (especially ‘value’). That was during the tremendous run-up in the ‘dotcom’ market. From early 2000 thru 2012, emerging markets once again delivered vastly better returns. During this period, the S&P experienced 2 significant bear markets (e.g., the unwinding of the “dotcom bubble” and the Global Financial Crisis). At both the mid-1990s and early 2010s peaks, emerging market equities traded at much higher PE multiples than today. At and near our bear market lows, the S&P 500 traded at very low PE multiples. Over the past 15 years, the S&P 500 has once again handily outpaced the MSCI emerging markets index.
It is too early to tell whether this is the beginning of a new trend where the S&P 500 underperforms other equity market segments. It could be that this modest downturn constitutes ‘a pause that refreshes.’ That said, a meaningful and sustained reversal is possible due to a variety of factors. Today, the S&P and NASDAQ are trading at the high side of their historical valuation metrics (e.g., PE ratio) while many EM and developed markets outside the U.S. are trading at the lower end of their absolute and relative to the U.S. historical valuation metrics. The U.S. dollar has been very strong relative to other major currencies. During periods of U.S. $ strength, U.S. stocks often outpace the returns of other markets. We believe there is a decent chance that other currencies may appreciate relative to the U.S. $ in the years ahead.i Investment flows have also been very strong in U.S. stocks – no doubt influenced by the gains we have seen for many years now. That too may change as investors have a tendency to become ‘net-sellers’ when headlines and returns turn less favorable. In the second endnote, I have included two charts. The first shows the most recent 15-year price performance for the S&P 500, as well as the MSCI Europe and the emerging markets indexes. The second shows the returns for S&P 500 and MSCI in the 7 years prior (e.g., March 31, 2003 thru April 6, 2010).ii As the charts show, these indexes perform very differently along the way.
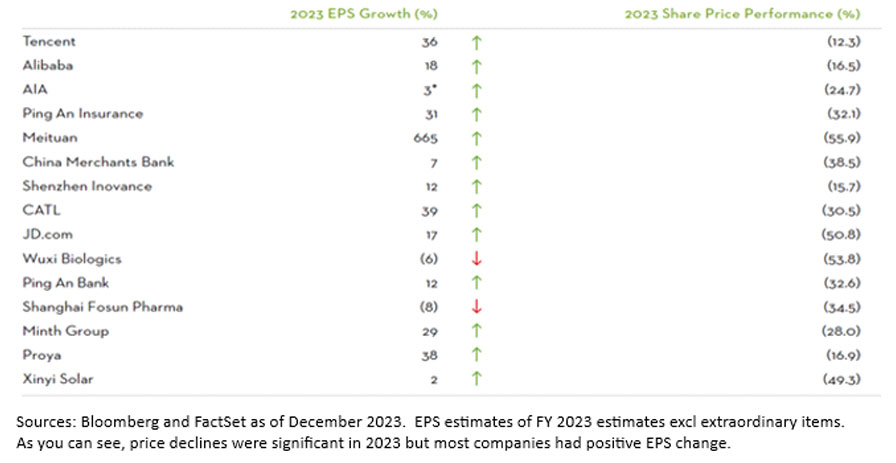
In my letter on April 2, 2024, I shared data on some of China’s leading technology companies. Below, I wanted to provide an update on the per share EPS change and attending valuation metrics for these companies. I have included the comments and charts I shared a year ago in an endnote to this letter.iii In 2023, these stocks performed extremely poorly despite healthy EPS gains in 2023 and a forecast for healthy EPS in 2024.
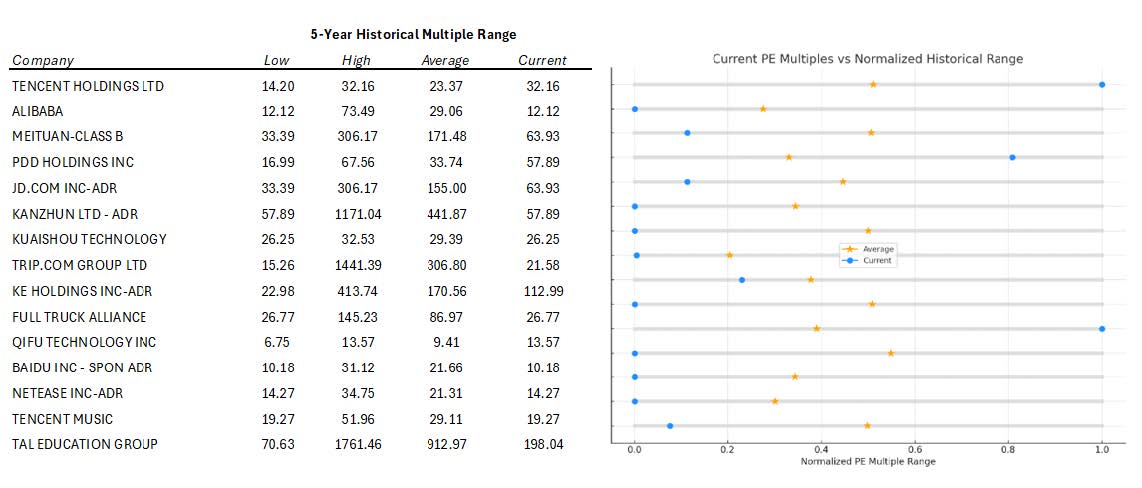
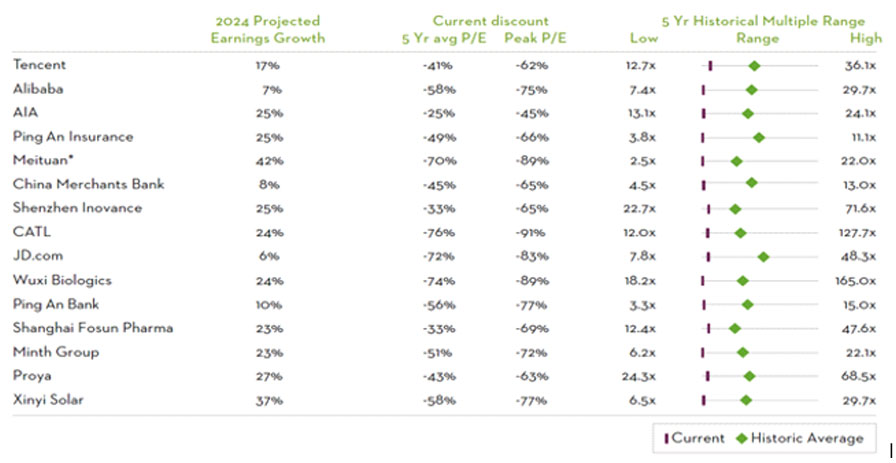
As you will see in the top table, EPS gains were generally favorable and in contrast to 2023, many of the share prices also increased significantly in 2024. In the second table below, you will see that most companies’ valuations remain on the lower side of the past 5-year range due to the healthy EPS gains. Most of these stocks are trading at large discounts to their 5-year peak valuations, and most are also well below their current 5-year average PE.
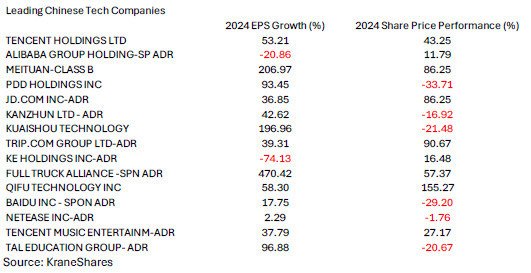
Source: KraneShares
Time will tell, but we believe these companies and stocks may continue to perform well over the coming years. Most importantly, we remain committed to maintaining broad diversification across all major market segments. Along the way, we will proactively monitor developments in capital markets here and abroad as we continue to seek to identify and add to segments that may provide favorable prospective returns.
As always, we welcome your comments and questions. Last but not least, if you have friends or family who you think may find our approach to be sensible, we would be pleased to see if we could help them with their financial planning and investment management needs.
Warmest regards and our sincere appreciation.
W. Richard Jones, CFA
Partner, Harmony Wealth Partners
i 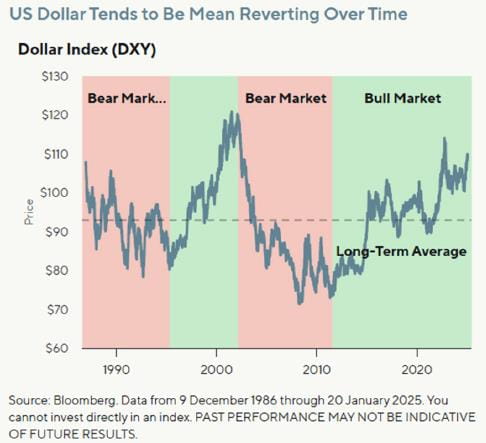
Source: GQG Partners and Bloomberg
ii 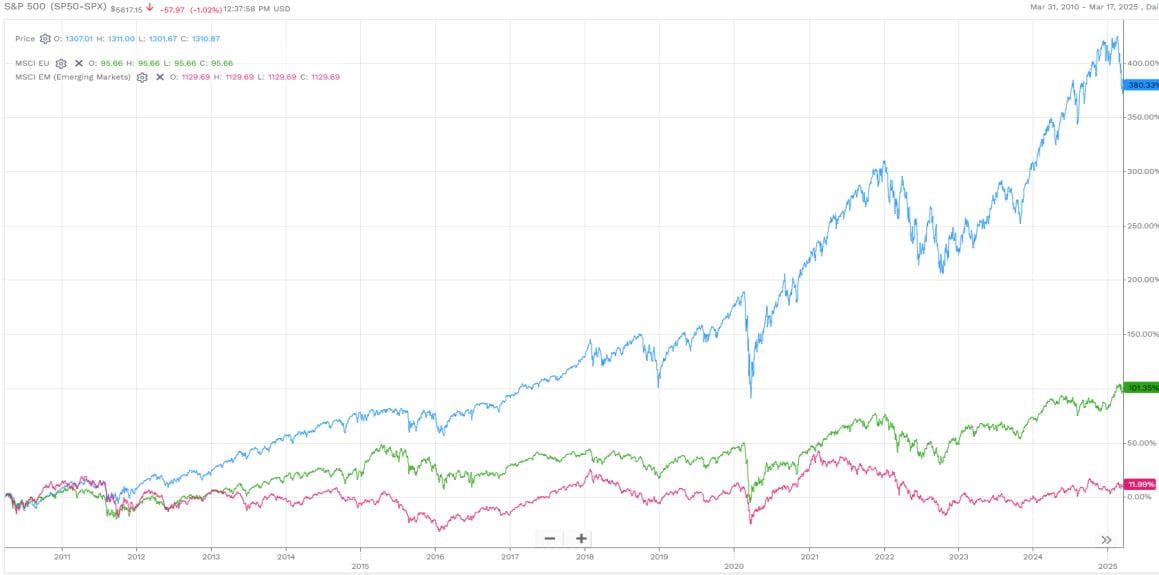
Chart above is past 15 years.
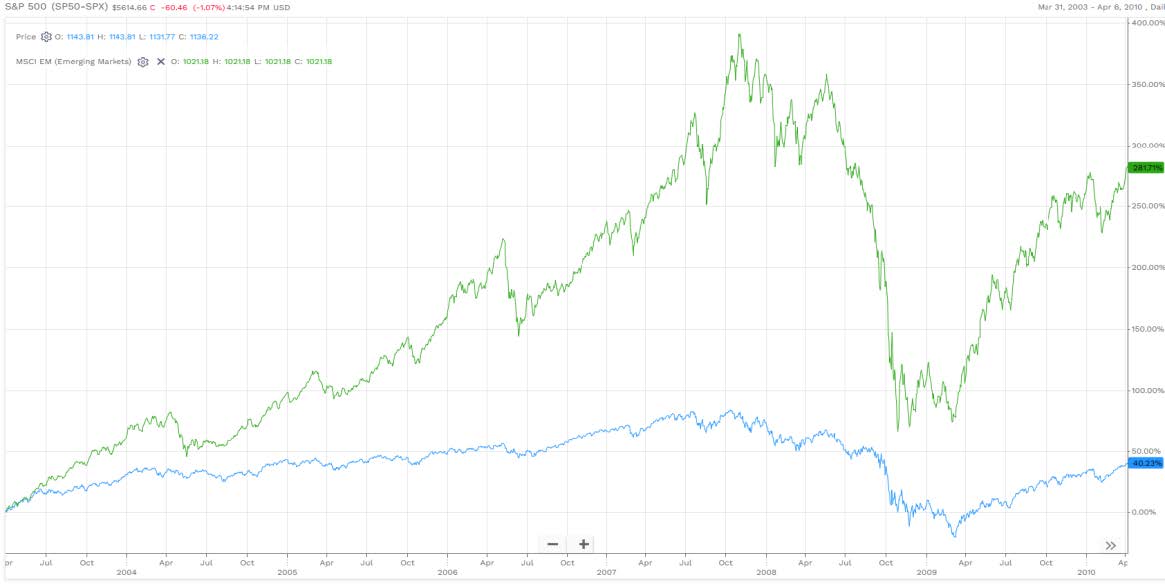
Chart above is the prior 7 years (e.g. 3/31/2003 – 4/06/2010)
Source: FactSet (price change only). Indexes shown in first chart - 1) S&P 500 is in blue (+380%), 2) MSCI Europe is in green (+101%) and MSCI Emerging Markets is in pink (12%). In the Second chart, MSCI EM is in green (+282%) and the S&P 500 is in blue (+40%). They perform differently along the way.
The tables below show some of the top Chinese stocks by market cap. The top table includes the 2023 EPS growth and price performance, respectively. The bottom table shows 2024 estimated EPS growth as well as the current and 5-year valuation metrics.
iii Throughout history, leadership changes among stock market segments (e.g., ‘growth’ vs. ‘value’ large vs. mid and small caps, U.S. and various international markets) have been commonplace. Many investors allocate to segments where returns have been pleasing and the news has been favorable. While that is understandable, it is important to recognize that stocks and major market segments often are priced significantly above and below historical valuation metric norms.
P.S. On a recent trip to NYC, I read an investment classic. Written in 1990, the short book is entitled A Short History of Financial Euphoria by John Kenneth Galbraith. It chronicles our collective propensity to pile into highly speculative and/or richly valued investments that capture investor attention, but ultimately prove to be fraught with risk. It is an easy and insightful read.
Any opinions are those of Richard Jones and not necessarily those of Raymond James. Any information is not a complete summary or statement of all available data necessary for making an investment decision and does not constitute a recommendation. Investing involves risk and you may incur a profit or loss regardless of strategy selected, including diversification and asset allocation. The S&P 500 is an unmanaged index of 500 widely held stocks that is generally considered representative of the U.S. stock market. The MSCI Europe Index is designed to measure equity market performance across 15 developed market countries in Europe. The index's three largest industries are financials, industrials, and health care. The MSCI Emerging Markets is designed to measure equity market performance in 25 emerging market indices. The index’s three largest industries are materials, energy, and banks. Keep in mind that individuals cannot invest directly in any index, and index performance does not include transaction costs or other fees, which will affect actual investment performance. Individual investor's results will vary. Past performance does not guarantee future results.
