Relative Strength Newsletter - 3rd Quarter 2022
Relative Strength Update
The third quarter is officially in the books, and it was another bumpy ride for investors. After getting off to a strong start – the S&P 500 gained more than 13% in the first half of the quarter – US equities faltered. A hotter-than-expected August CPI reading dashed hopes for a dovish pivot from the Fed. Sentiment soured further following the Fed’s September meeting as officials reaffirmed their commitment to reigning in inflation, raising their projections for the terminal level of interest rates and unemployment, which raised doubts about the prospects for a so-called “soft landing.”
The Stock Trader’s Almanac says, “September is when leaves and stocks tend to fall, on Wall Street, it’s the worst month of all.” That adage certainly proved true this year as the S&P finished the month down more than 9%, its worst monthly return since March 2020 and its worst September since 2002. The S&P finished the quarter down around 5%, falling below its June low. Through the first three quarters of the year, the S&P shed almost 25%, putting it on pace for its worst year since 2008.
The third quarter was also difficult for bond investors. The same factors that hampered stocks – high inflation and a hawkish Fed – helped push interest rates higher. The 10-year US Treasury yield soared past its June high, reaching nearly 4%, its highest level since 2010. The Bloomberg Barclays US Aggregate Bond Index was down nearly 5% for the quarter, bringing its year-to-date loss to nearly 15%.
Commodities also cooled during the third quarter. The S&P GSCI Commodity Index was down more than 10% as the strength of the US dollar, which hitherto had had little effect, seemed to finally weigh on commodities prices. The decline in commodities was led by WTI crude oil, which was down more than 20%, while industrial and precious metals also declined. While this was certainly not a welcome development for commodities investors, there is a silver lining, as lower commodity prices may mean that inflation is finally beginning to moderate.
The strong US dollar also continued to weigh on international stocks as the MSCI EAGE and MSCI Emerging Markets Indexes were each down double digits.
As we head into the final stretch of the year, we continue to monitor closely for any shifts in the market landscape. The market is clearly on rocky footing, however, there have been bright spots. From a sector perspective, energy sits atop the rankings within the Relative Strength research that we perform. This research provides us with a heat map of where relative strength (and weakness) resides across and within asset classes. Meanwhile, despite softening during the third quarter, commodities remain at the top of our major asset class rankings.
Midterm Elections Could Provide Relief from Uncertainty
There have been many different catalysts for price movement over the past year. We began the year with continued concerns around new virus variants while still recovering from the pandemic that began in 2020. Focus quickly shifted to western Europe in the first quarter as all eyes were following the war between Russia and Ukraine, which continues to this day. Meanwhile, the US and most other nations around the globe are currently struggling to tame inflation. With all the other catalysts for major market movement over the past several months, it may be easy to forget that we are in the midst of a mid-term election year.
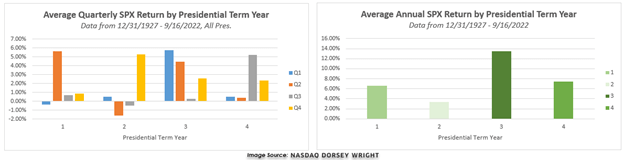
Our friends at Dorsey Wright and Associates have compiled and examined election data going back to 1927. Leaving political affiliations on the sidelines, they found that certain themes are evident when examining market returns during past presidencies. They took the quarterly returns for the S&P 500 Index SPX since 1927 and organized them by the year of each presidential term. This data showed that the second year of a presidential term typically carries the worst returns, with SPX showing a modest gain of 3.36%. Furthermore, the second quarter of year two shows the worst average return of any single quarter in their examination at -1.60%. Thus far Third Quarter action through Friday, September 16, shows a similar picture. The year-to-date decline of -18.73% so far this year is far worse than the 27% gain seen in the first year of the current presidential term. The Q2 return this year of -16.45% is also the lowest returning quarter thus far in Biden’s presidency.
As we are often reminded, past performance is not indicative of future results. However, the historical tendencies of past presidencies do point toward the potential for stronger returns following the mid-term election cycle. The third year of a presidential term shows an average gain of 13.51%, with year three showing a positive return in 18 of the 24 instances examined. In fact, Q4 of year two and Q1 of year three show the best back-to-back averages of any two quarters, with each averaging a gain of more than 5%.
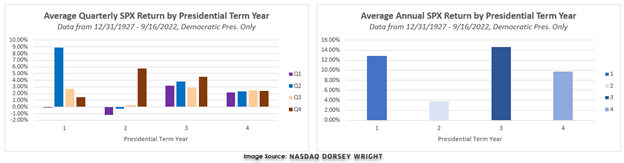
Narrowing the examination down to just the democratic presidencies shows a very similar picture, even though we only view 50 of the 95 years since 1927. This data shows the first year of a presidential term demonstrating strong returns, which are again followed by the lowest average annual returns of any term year at a gain of 3.76%. The democratic presidencies show the weakest quarters occurring in Q1 and Q2 of year two, which would match the movement thus far through the current presidential term. The third year still shows the strongest average returns at 14.68%.
We have no way of knowing with certainty whether the months to come will follow suit with the historical tendencies following mid-term elections. However, one interpretation of the data could circle back to the concept of financial market participants feeling more comfortable with defined expectations. This would maintain that markets rise in the first year of a presidential term as the uncertainty from the presidential election is alleviated. The second year comes with an enhanced potential for market weakness amid new uncertainty from upcoming mid-term elections. The third year would then show the strongest returns as the mid-term elections both remove the congressional uncertainty and indicate which direction the country may lean in the next presidential cycle.

Tumlin Levin Sumner Wealth Management of Raymond James
Please be aware that the content of this newsletter is based on the opinion of Dorsey, Wright research and may differ from the research provided by your financial advisor. This market theme letter was written by Dorsey, Wright & Associates and is provided courtesy of your advisor.
The performance numbers in this article do not reflect transaction costs. Indexes are not available for direct investment. Past performance is not indicative of future results and there is no assurance that any forecasts mentioned in this report will be attained.
Stocks offer growth potential but are subject to market fluctuations. Dividends are not guaranteed; companies can reduce or eliminate their dividend at any time. There are special risks associated with an investment in real estate, including credit risk, interest rate fluctuations and the impact of varied economic conditions.
The information contained herein has been prepared without regard to any particular investor’s investment objectives, financial situation, and needs. Accordingly, investors should not act on any recommendation (express or implied) or information in this material without obtaining specific advice from their financial advisors and should not rely on information herein as the primary basis for their investment decisions. Information contained herein is based on data obtained from recognized statistical services, issuer reports or communications, or other sources believed to be reliable (“information providers”). However, such information has not been verified by Dorsey, Wright & Associates, LLC (DWA) or the information provider and DWA and the information providers make no representations or warranties or take any responsibility as to the accuracy or completeness of any recommendation or information contained herein. DWA and the information provider accept no liability to the recipient whatsoever whether in contract, in tort, for negligence, or otherwise for any direct, indirect, consequential, or special loss of any kind arising out of the use of this document or its contents or of the recipient relying on any such recommendation or information (except insofar as any statutory liability cannot be excluded). Any statements nonfactual in nature constitute only current opinions, which are subject to change without notice. Neither the information nor any opinion expressed shall constitute an offer to sell or a solicitation or an offer to buy any securities, commodities or exchange traded products. This document does not purport to be complete description of the securities or commodities, markets or developments to which reference is made. Potential for profits is accompanied by possibility of loss.
The material has been prepared or is distributed solely for information purposes and is not a solicitation or an offer to buy any security or instrument or to participate in any trading strategy.
Opinions expressed in the attached article are those of the author and are not necessarily those of Raymond James. All opinions are as of this date and are subject to change without notice. The investment profile examples are hypothetical, and the asset allocations are presented only as examples and are not intended as investment advice. Please consult with your financial advisor if you have questions about these examples and how they relate to your own financial situation. The information contained in this report does not purport to be a complete description of the securities, markets, or developments referred to in this material. Any information is not a complete summary or statement of all available data necessary for making an investment decision and does not constitute a recommendation. Past performance may not be indicative of future results. Investing involves risk and you may incur a profit or loss regardless of strategy selected, including diversification and asset allocation. Prior to making an investment decision, please consult with your financial advisor about your individual situation. There is an inverse relationship between interest rate movements and bond prices. Generally, when interest rates rise, bond prices fall and when interest rates fall, bond prices generally rise. Investing in commodities is generally considered speculative because of the significant potential for investment loss. Their markets are likely to be volatile and there may be sharp price fluctuations even during periods when prices overall are rising. The companies engaged in the communications and technology industries are subject to fierce competition and their products and services may be subject to rapid obsolescence. The Dow Jones Industrial Average (DJIA), commonly known as “The Dow” is an index representing 30 stock of companies maintained and reviewed by the editors of the Wall Street Journal. The S&P 500 is an unmanaged index of 500 widely held stocks that is generally considered representative of the U.S. stock market. The NASDAQ composite is an unmanaged index of securities traded on the NASDAQ system.
This information was developed by First Trust, an independent third party. The opinions of Brian S. Wesbury, Robert Stein and Strider Elass are independent from and not necessarily those of RJFS or Raymond James.